Kzmi92
-
Posts
7 -
Joined
-
Last visited
Kzmi92's Achievements
")


-
You will need to extract the .rar file with 7zip and have a look inside. It's compressed, comparable to a .zip file.
-
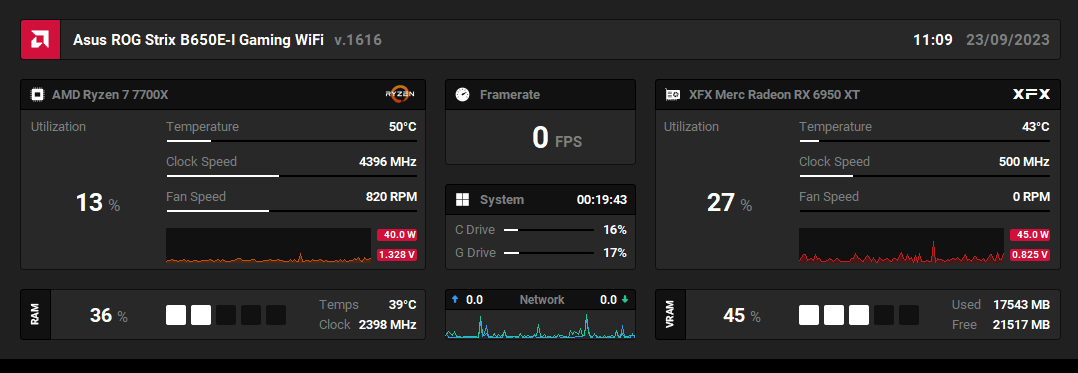
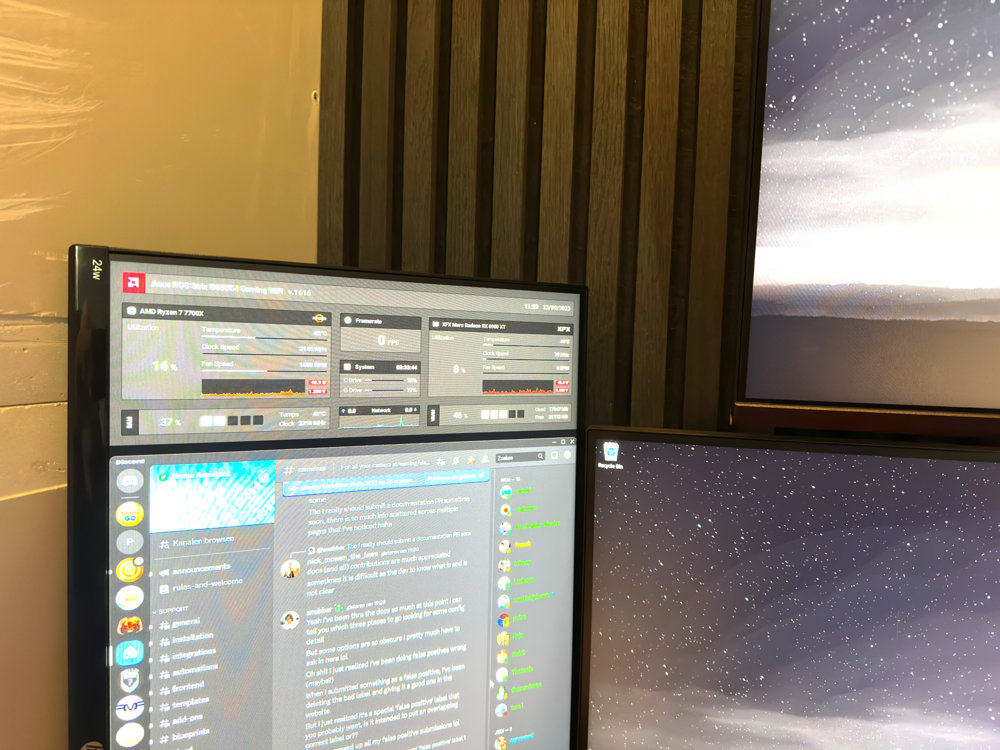
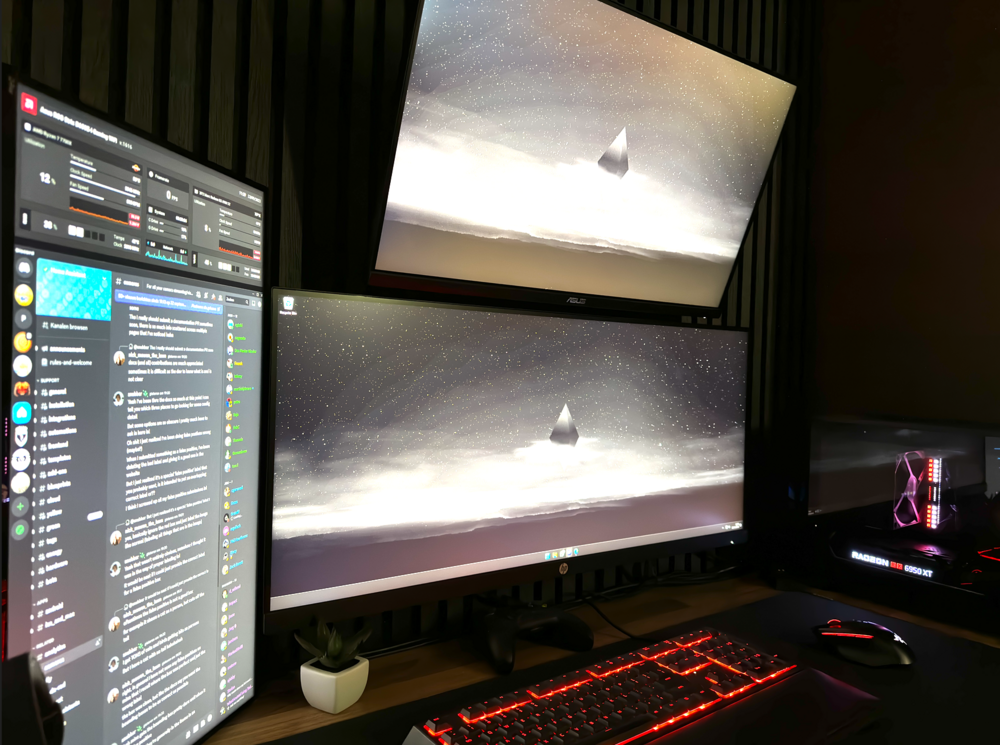
2 weeks ago I completed my first full AMD build. Ofcourse this needs a matching sensorpanel! This one is based on the AMD Adrenalin software. Still need to add gauges to the CPU and GPU utilization, but not sure yet what gauges I will use, so thought I would share already anyway. Format may be a bit odd (1080x380), but I use it on a portrait orientated 24 inch monitor and it has discord underneath it so it fits perfectly for me. The download includes all PSD files aswell, so you can play around and adjust it to your desired size. Enjoy! Sensorpanel.zip

-
I know this is an old reply but was looking for something similar and found this post. If you're using google chrome you can cast any window from your pc to the nest hub, so also the aida64 sensor panel.
-
Hi, We're able to correct the usage for GPU clock, temperatures, cooling fans, voltage and power. Is it somehow possible to correct the CPU and GPU usage -1 so when using a sensorpanel that fits 2 numbers does not get messed up when the GPU is pushed to 100% and stays on 99% instead?
-
A taskmanager like sensorpanel I created. Simple and clean (Using voltage instead of temperature for memory because Aida takes 5 seconds to update ram temp ) 480x800 taskmgr.sensorpanel
-
Anyone who can shed a light on the differing CPU usage and temperatures?
-
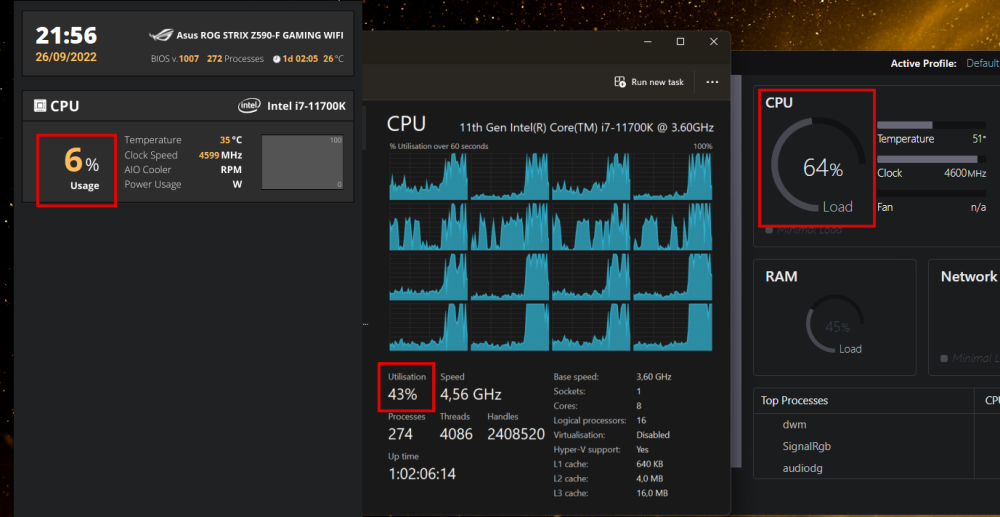
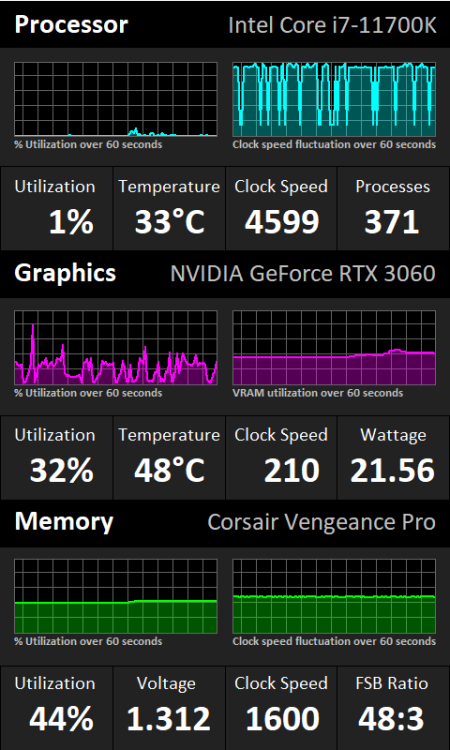
Hi, I'm currently creating my first sensor panel, but I have a few questions. - Is it possible to show the temperature text (26°C) in a different color when temperature changes? Like green for low temperature, red for high temperature. I know it's possible with graphs, but I don't find a way to do it with the text. - My fans are not detected in Aida64, however they are in NZXT Cam for example, how can I troubleshoot this? - My CPU usage is different in 3 different monitoring apps, which one is most accurate and why are they so much off? See the image below. (I'm using the CPU Utilization sensor) - Also CPU temp from NZXT Cam and Aida64 differs 16°C Thanks in advance!