


honolulu
-
Posts
9 -
Joined
-
Last visited
Content Type
Profiles
Forums
Events
Posts posted by honolulu
-
-
It could very well be some bugs in the bios .
I also notice a 10% performance drop in 3dmark firestrike with virtualisation enabled in the bios . I don't think that's normal either .
-
Fair enough , thanks for your honesty .
If you need some more info , just ask .
Would this also mean that if i use aida64 for just cpu monitoring for example , it would not crash my system anymore ? Or does that have nothing to do with it .
I can also mention that when i monitor the vega 56 card with GPU-Z , it doesnt not crash or bluescreen .
-
Long story short , since june 2019 i have a new videocard (MSI Vega 56 Air boost OC) , which I am trying to get stable for the past 3 months now . I have been trying everything , swapping hardware in and out , changing fansettings , adding fans , DDU drivers , updating all programs/drivers on my pc and what not . Every time the PC crashes , i have to do a CMOS reset to get the pc to boot again . Just a restart or power down is not enough .
The "Thread stuck in device driver" blue screen analysis points towards DX and AMD drivers , hence me being focused on those things at first .So in the end nothing helped and I decided to try to run stability tests in a completely new windows 10 x64 installation . Only installing chipset driver , sound drivers and videocard drivers . Suddenly no more crashes ... Since in a clean windows install stopped the crashes (meaning the hardware is fine) , i went back to my old windows installation to try and find out what software was causing these BSOD's .
In the end I had a stable run of several hours .Yay ! Where the only program i closed was AIDA64 . So I decided to stop the stability test . After closing the stability run (Heaven benchmark) I opened AIDA64 back up .
What do you think , mere 2 minutes after opening I get BSOD with thread stuck in device driver again . And this was just on the desktop , with no stresstests running .So the next day i closed 3 monitoring programs to be sure : AIDA64 , Rivatuner statistics server and Remote panel . I fired up a gpu stresstest and let it run all day and night . No crash ... . It was still running when i woke up the next day . This never happened before !
Software versions :
- AIDA64 (I always used latest beta's since june 2019 . currently using 6.00.5161)
- Rivatuner statistics server 7.2.2
- Remote panel 1.16
- AMD driver always latest optional since june (currently 19.9.2)The output of my monitoring currently goes towards a Samsung Galaxy s5 connected through usb) . But before I used a G19 keyboard , which was causing the same BSOD .
To this post I also attached a bluescreen analysis with WhoCrashed .
-
#1 see attachment
#2 it is already enabled . so i can not enable enable it
")
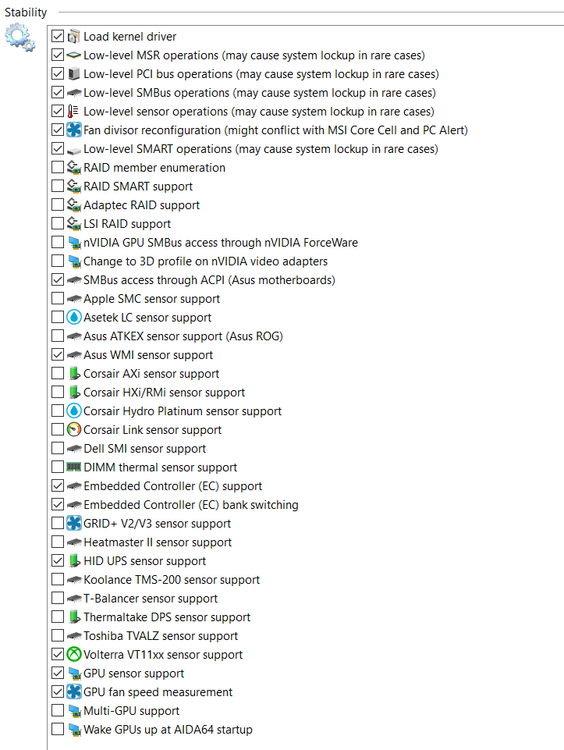
see list of what's enabled (stability.png)
-
All 3 requested dumps attached .
-
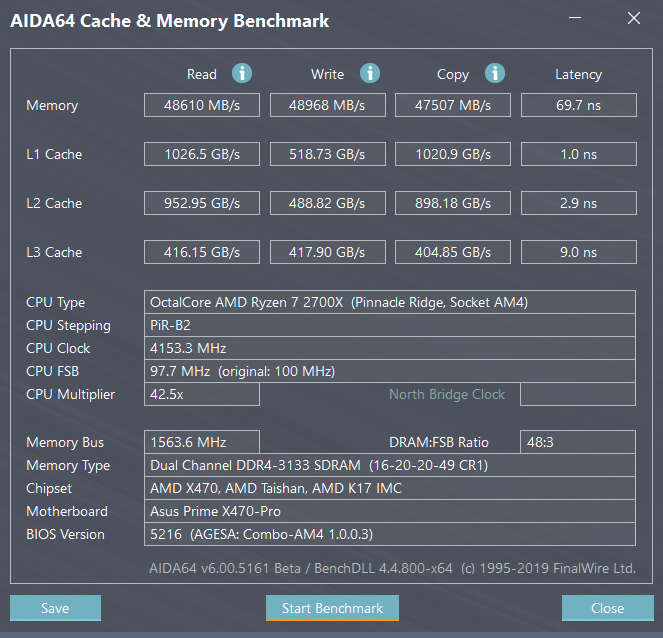
1- When i enable virtualisation in the bios , i notice that the reported fsb and memory speeds are different than what is set in the bios .
For example , i set 3200 mhz ddr4 in the bios and it will report as 3133 in aida64 with an fsb of 97.7 .
FSB can not even be changed in the bios as it is always 100 (99.8) on this board .
Happens on the 2 latest bios versions being 5204 amd 5216 .
Disabling virtualisation in the bios makes aida64 report correct speeds .
2- This particular thing only happens on bios 5216 : Chipset temperature option in aida64 is lost , Custom temp sensor reading option in aida64 is lost , CPU_OPT fan speed is not shown anymore in aida64 .
Motherboard is Asus Prime x470 Pro .
-
Thank you for your help Fiery .
I found the hotkey function per your instructions and it works perfectly !
I have thought about the workaround which you suggested , to make 1 big page and then move it around . But , since some of my pages are very taxing on the cpu (probably because there are quite a few graphs/histograms and all of them get the general 2 second refresh applied) … I don't like to tax my cpu with 10%+ load all the time just for the numbers and graphs . Even though they would be "off screen" , they will still cause the load .
With different pages , i can only go to a taxing page when i need it .If that makes sense to you .
-
Is there a way to change between pages without having to open the preferences in aida64 and manually selecting which page to be set as active? ie: a hotkey or similar, just to flick between pages?
I really thought I had seen "bullets" on my monitoring smartphone running the remotesensor app before , but at the time i only had 1 page .
Now I got 2 pages and want to make a third , but i don't see these "bullets" anymore , and i can't flick to another page ?
Is there any way to get this functionality activated again ?

Thread stuck in device driver (BSOD) (MSI Vega 56 PMLog issue)
in Bug reports
Posted
Using GPU-Z together with HWINFO64 , I have had one bluescreen with "thread stuck in device driver" in the past weeks . Just to say that they also have it , only way less frequent compared to AIDA64 (for me at least) . AIDA64 would cause this bsod at least once a day .
The fact that all these monitoring programs cause the BSOD at a more or less frequent rate , would this point to an issue with the AMD API itself ?