Jump to content

nyncuk2003

Members
  • Posts

    4
  • Joined

  • Last visited

Posts posted by nyncuk2003

  1. On 12/6/2021 at 5:19 PM, ThatManOnTheMoon said:

    Thanks, appreciate it. Basically there are 4 line graphs and 2 area graphs. 3 line graphs of different shades of red are stacked on top of each other to create a gradient. There is 1 dark-grey line-graph below the red line to create a drop shadow.

    The 2 area-graphs below the red line give the 2 shades of grey. The darker-grey area graph has a lower height. The drop shadow of the red line covers the bright line of the lighter-grey area-graph (area graph has a line with a darker shade of color below it). Got to play with the height so the line graph(s) doesn't clash with darker area-graph.

    I haven't really tested how much resources it uses. Still playing around with it. Like how it looks though.

    reMBXjw.png


    rVqh2VF.png

    Great! Can you share please?!

  2.  

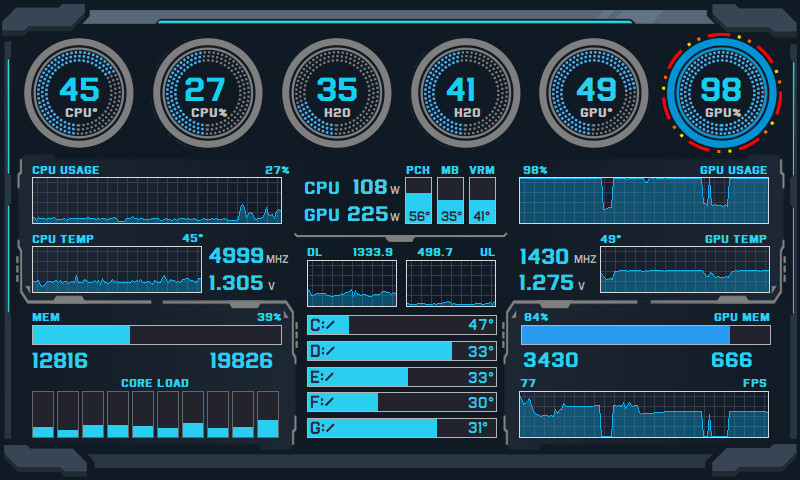
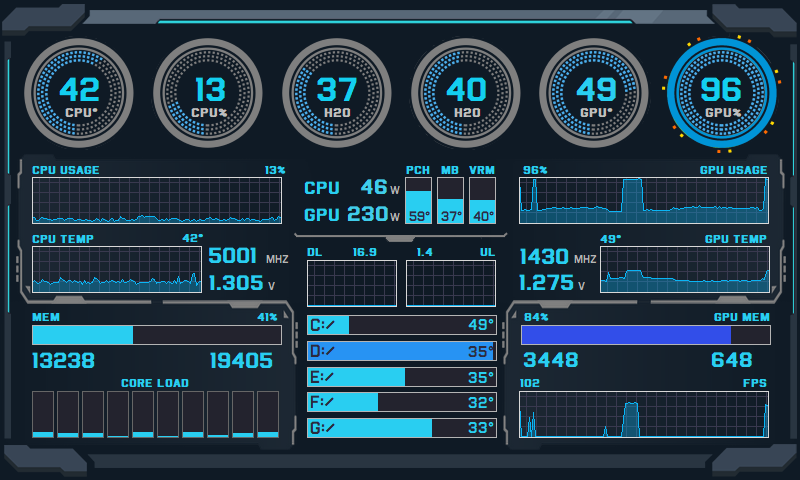
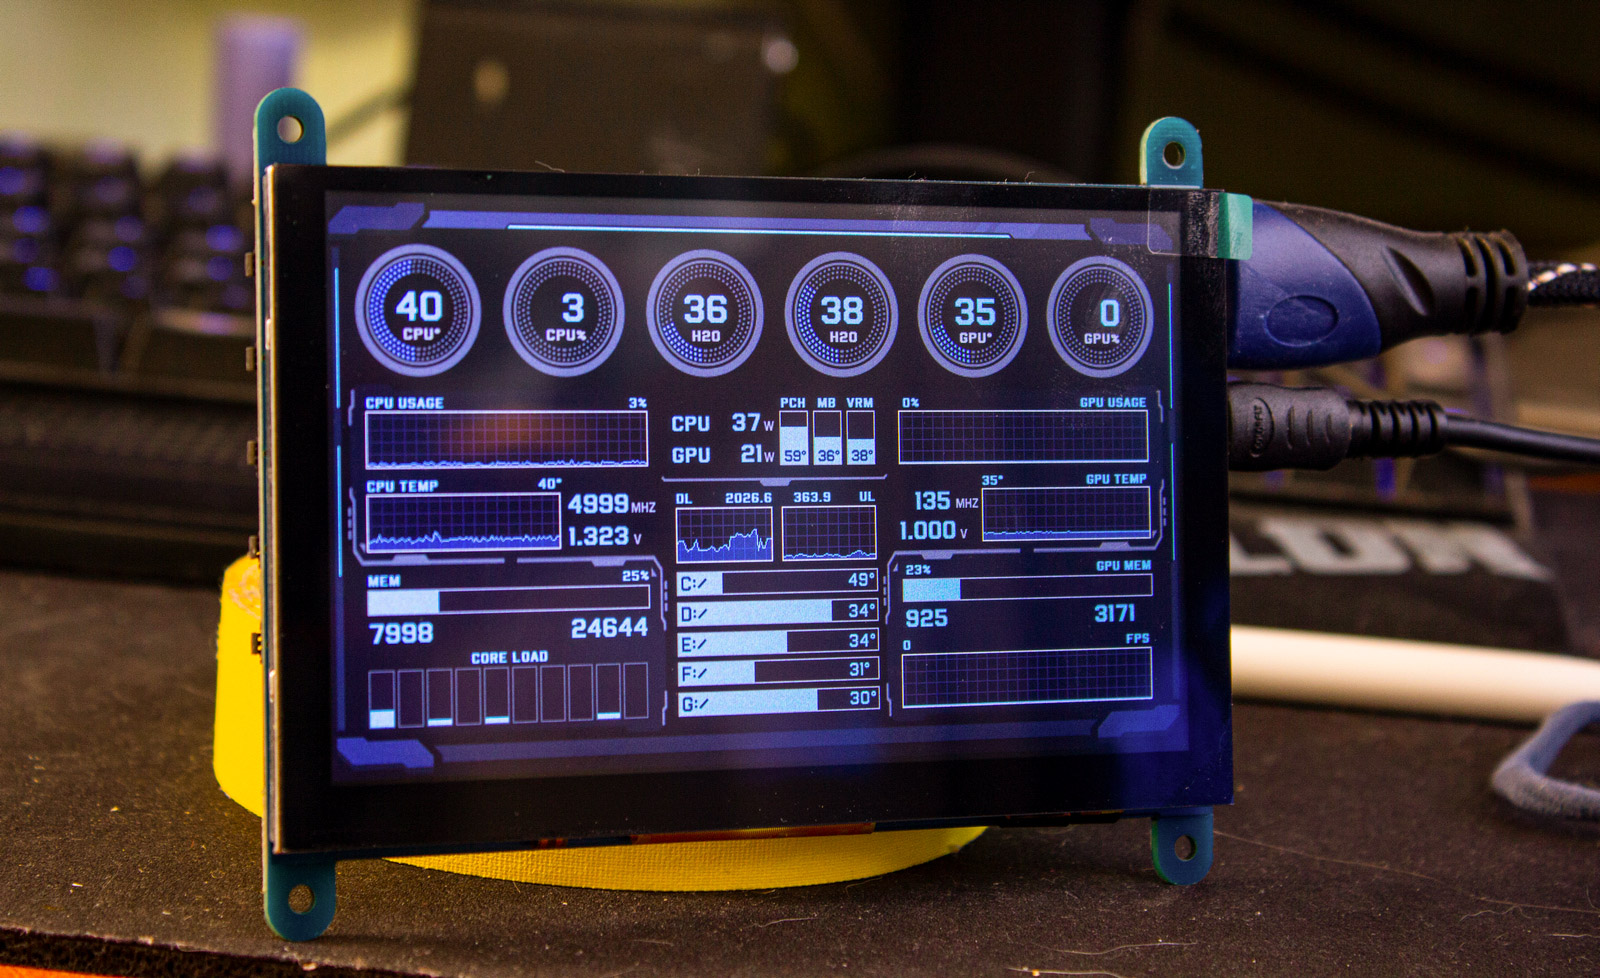
    Hey! I am sharing my project for a 800 * 480 display. Many thanks to the authors for the visuals they shared. The idea was to put as much information as possible on the small 5 "display. The water sensors are not connected now, so the H2O values need to be replaced with what you want. 

    When I install the display in the case, I will show the result =)

    Font Airborne


    project1.jpg

    PSX_20210201_155819.jpg

    project1.sensorpanel Airborne.ttf

    • Like 13
×
×
  • Create New...