


ldwilliams.uk
-
Posts
12 -
Joined
-
Last visited
Content Type
Profiles
Forums
Events
Posts posted by ldwilliams.uk
-
-
A friend has very kindly calculated the offset and ratio for the Alphacool ES flow and temperature indicator "HighFlow" with RPM-Signal
They are as follows -Ratio = 0.1709018653
Offset = 63.94619272
With the following results, not perfect but acceptable I feel -
Rpm (given by Alphacool)
l/h (given by Alphacool)
Formula l/h % Error Exact formula 35 75 69.95 -6.73% 69.92775801 80 80 77.6 -3.00% 77.61834195 100 85 81 -4.71% 81.03637925 127 90 85.59 -4.90% 85.65072962 156 95 90.52 -4.72% 90.60688371 188 100 95.96 -4.04% 96.0757434 215 105 100.55 -4.24% 100.6900938 255 110 107.35 -2.41% 107.5261684 290 115 113.3 -1.48% 113.5077337 320 120 118.4 -1.33% 118.6347896 350 125 123.5 -1.20% 123.7618456 380 130 128.6 -1.08% 128.8889015 420 135 135.4 0.30% 135.7249762 485 140 146.45 4.61% 146.8335974 515 145 151.55 4.52% 151.9606534 560 150 159.2 6.13% 159.6512373 580 155 162.6 4.90% 163.0692746 605 160 166.85 4.28% 167.3418212 630 165 171.1 3.70% 171.6143679 660 170 176.2 3.65% 176.7414238 675 175 178.75 2.14% 179.3049518 695 180 182.15 1.19% 182.7229891 720 185 186.4 0.76% 186.9955358 745 190 190.65 0.34% 191.2680824 775 195 195.75 0.38% 196.3951383 810 200 201.7 0.85% 202.3767036 840 205 206.8 0.88% 207.5037596 860 210 210.2 0.10% 210.9217969 885 215 214.45 -0.26% 215.1943435 915 220 219.55 -0.20% 220.3213995 940 225 223.8 -0.53% 224.5939461 955 230 226.35 -1.59% 227.1574741 975 235 229.75 -2.23% 230.5755114 1005 240 234.85 -2.15% 235.7025674 1035 245 239.95 -2.06% 240.8296233 1075 250 246.75 -1.30% 247.6656979 1100 255 251 -1.57% 251.9382446 1130 260 256.1 -1.50% 257.0653005 1160 265 261.2 -1.43% 262.1923565 1190 270 266.3 -1.37% 267.3194125 1220 275 271.4 -1.31% 272.4464684 1260 280 278.2 -0.64% 279.282543 1290 285 283.3 -0.60% 284.409599 1320 290 288.4 -0.55% 289.5366549 1350 295 293.5 -0.51% 294.6637109 1380 300 298.6 -0.47% 299.7907669 1410 305 303.7 -0.43% 304.9178228 1440 310 308.8 -0.39% 310.0448788 -
On 3/17/2024 at 3:03 PM, Surjeet said:
Hi @ldwilliams.uk,
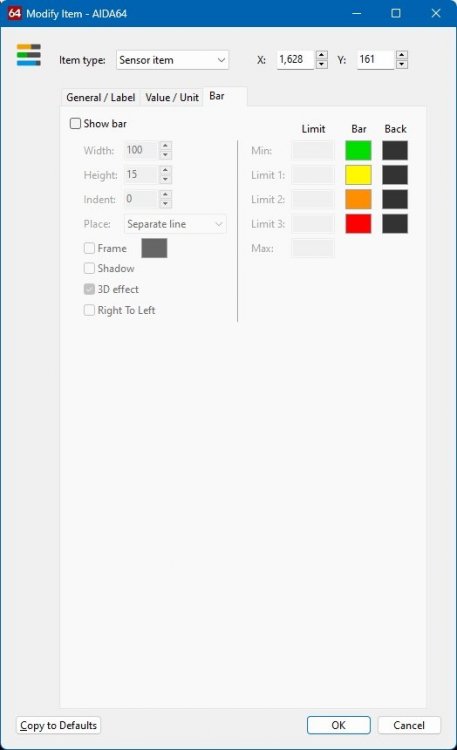
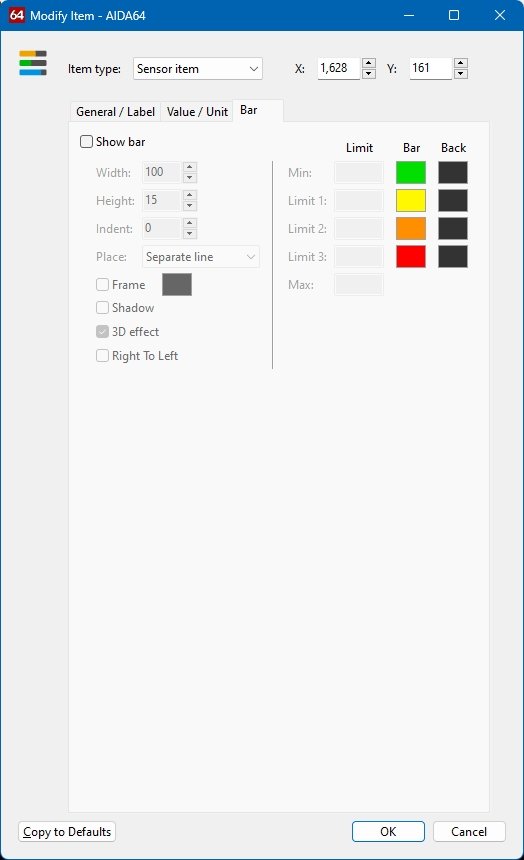
Colour of the font can not be set; however, bar can be used below, side, up of the font to change colours!
If you are not interested in 100 gauges Custom Gauge, you may simply use the Sensor item and can create a Thin bar to change its colour as per the range given.
You may set the Min Max and Limit 1 to 3 and set required colours for these ranges too.
When you Show bar you may control Width Height etc. Please find below the screenshot:
I think you may have tried it!
To answer your question, We are limited to 16 images per Sensor; however, can use them multiple times to use the images from 0-100.
That's the perfect measurement; however, that takes lot of time to create such gauges. Personally, I love using 100 gauges meter for their precision and perfect accuracy!
yes I know about the bar charts. They are good for simple ranges, but only have 4 ranges which is nowhere near enough, the 16 is a lot better.
Ideally I feel, 10 or 20 images would have been the better choice (so that you would then have a colour change every 5 of 10C), but I understand that we are looking at degrees of a circle and neither 10 nor 20 easily fit within 360 degrees.
Thank you -
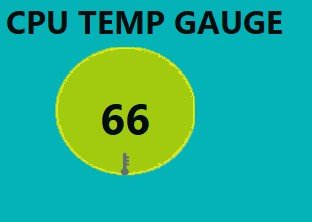
Got a rough first idea sorted, it's Not pretty, but it works.
A simple coloured circle with CPU temp in it, with the background colour changing ever 6C.I can tidy it up later, the basic idea works.
I still would have prefered the actual figures to be able to change colours, but got to work with what is there.
-
2 hours ago, Fiery said:
I've checked the link and it still works.
Thanks - Had to use a browser Other than Chrome, as Chome was saying that it wasn't a secure link and would not download the file.
Now all set up -
On 1/18/2023 at 12:02 PM, Fiery said:
I cannot find that zip file

Can you relink it please? -
8 hours ago, rinaldop said:
Your best try would be to create a custom gauge. Then you can control exactly what is displayed. A gauge usually uses 15 images with the first image being 0 for a total of 16. Try creating what you want to see in 15 .png images and create a custom gauge.
Here is an example
https://forums.aida64.com/topic/13296-share-your-sensorpanels/page/474/#comment-57022
Here is how they were made
https://forums.aida64.com/topic/13296-share-your-sensorpanels/page/474/#comment-57018
Thanks for the input.
I have no Idea how to create a custom gauge, just looked it up, seems tedious, especially for 100 different settings.
Are we limited to 16 images then?
If so then that won't work for temperature I'd have thought, as that will be 1 - 100C as a minimum range -
Hi,
New, Learning.
Is there a way to the data change colour once a set limit has been reached?
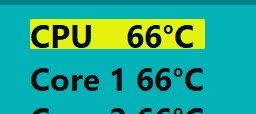
Something like a bar, but instead of the bar changing colour the actual figures do.Best I have come up with so far is to mess with a bar so that it becomes the background to data and reflects the colour range that way, rather than the actul data changing colour.
It's not ideal though
-
This bring results of
Actual l/hr Reported l/hr
40 48.86 50 56.42 60 62.72 70 70.82 80 78.74 90 81.8 100 90.8 110 105.2 120 116 130 122.66 140 130.94 150 143 160 162.8 170 176.12 180 181.52 190 189.8 200 204.56 210 211.04 220 219.5 230 227.96 240 241.64 250 247.4 260 255.86 270 270.8 280 279.44 290 285.2 300 293.3 -
I think that the ratio is 0.18 and the offset is -10 ?
-
A friend says that ratio 0.18, offset 10 fits well
Correction to this -
Alphacool look to have changed this, these are the corrected figures -
Ratio = 0.1709018653
Offset = 63.94619272
Which produces the following results - not perfect, but usable I feel
'rounded' is the result that would be shown.
RPM L PER HR rounded 35 75 70 80 80 78 100 85 81 127 90 86 156 95 91 188 100 96 215 105 101 255 110 108 290 115 114 320 120 119 350 125 124 380 130 129 420 135 136 485 140 147 515 145 152 560 150 160 580 155 163 605 160 167 630 165 172 660 170 177 675 175 179 695 180 183 720 185 187 745 190 191 775 195 196 810 200 202 840 205 208 860 210 211 885 215 215 915 220 220 940 225 225 955 230 227 975 235 231 1005 240 236 1035 245 241 1075 250 248 1100 255 252 1130 260 257 1160 265 262 1190 270 267 1220 275 272 1260 280 279 1290 285 284 1320 290 290 1350 295 295 1380 300 300 1410 305 305 1440 310 310 -
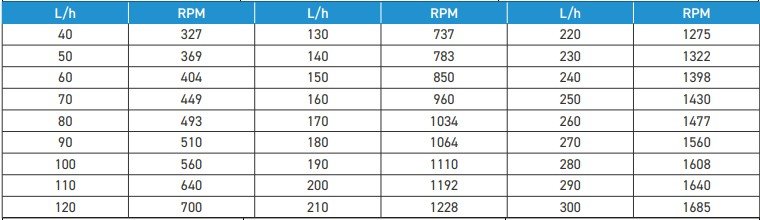
Hi, I am looking to get the Alphacool ES flow and temperature indicator "HighFlow" with RPM-Signal
https://shop.alphacool.com/en/shop/controllers-and-sensors/flow-sensor/17558-alphacool-es-flow-and-temperature-indicator-highflow-with-rpm-signalIt has a conversion table for RPM to litres per hour which should be simple enough I would have thought, but the conversion ratio looks to change for each rpm given?
How do I create an offset (think thats what is needed) and what would the offest be please anyone?
Thanks
Colour coded data
in SensorPanel
Posted
That's neat, shame then that there are only 4 ranges