


TomWoB
-
Posts
18 -
Joined
-
Last visited
-
Days Won
2
Content Type
Profiles
Forums
Events
Posts posted by TomWoB
-
-
OK Kappa,
seems to be a Culture Settings problem. With
- English-Windows and
- English-AIDA64
Try this:
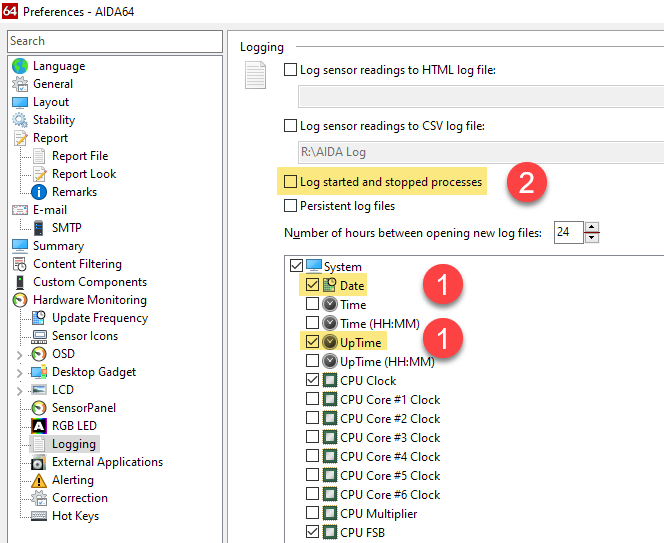
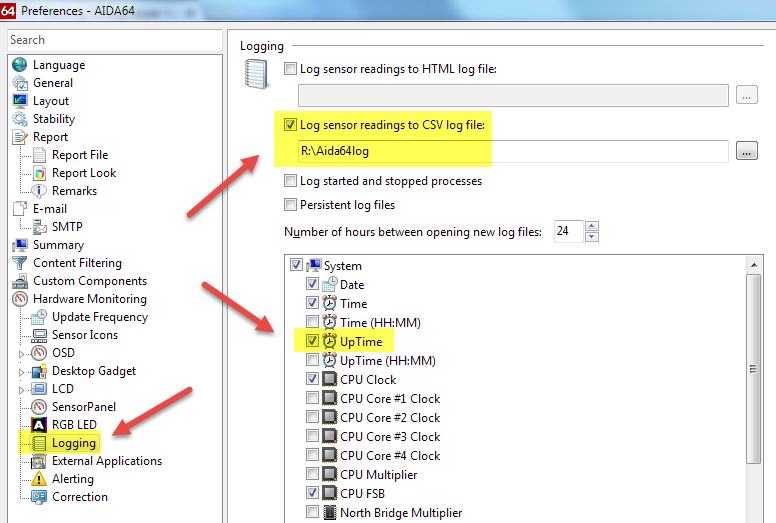
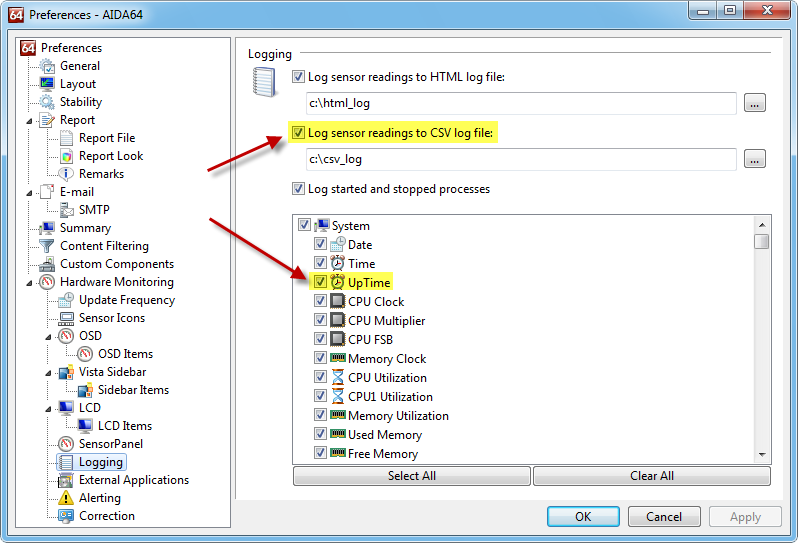
(1): use from the five Date & Time possibilities only the two I marked yellow !
(2): uncheck "Log started and stoppen processes"
Hope this helps ...
Tom-
 1
1
-
Hi Kappa,
yes, tool is still supported. I tested Generic Log Viewer with latest AIDA64 Version 6.32.5600: works fine !
Please verify the following Preferences: Hardware Monitoring -> Logging
- Log sensor readings to CSV log file -> checked
- System.Date -> cecked
- System.Time and/or System.UpTime -> checked
Regards Tom
-
New version 5.2 available !
Hi all, I built a version 5.2 with the following new feature:
- ability to save the current setup
- ability to load a previous saved setup
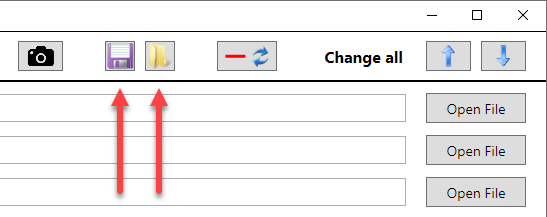
After loading a logfile, the two new buttons are shown. They allow to save/load your parameters of the GenericLogViewer like:
- number of diagrams
- diagram types
- selected categories
- ...
Only logfile specific parameters are not saved, like filenames, time windows (makes no sense).
Remark:
depending on the "complexity" of the setup (6x2 diagrams, each with 3 categories, ...) it can take "some seconds" until setup is activated ... stay cool")
Download-Link: see first post of this thread !
-
 1
1
-
New version 5.0 available !
Hi all, I built a version 5.0 with the following new features:- MSI Afterburner Logs are now supported too (*.hml)
- "Statistic"-diagram got many improvements (now it works as it should)
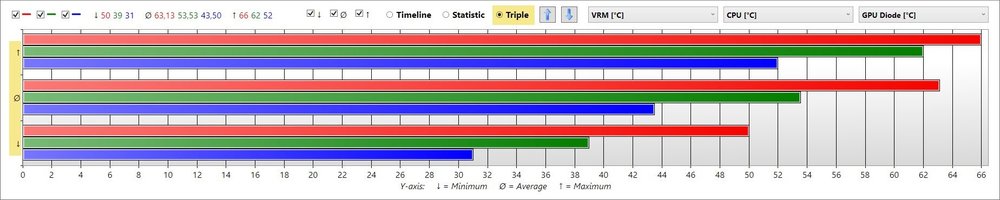
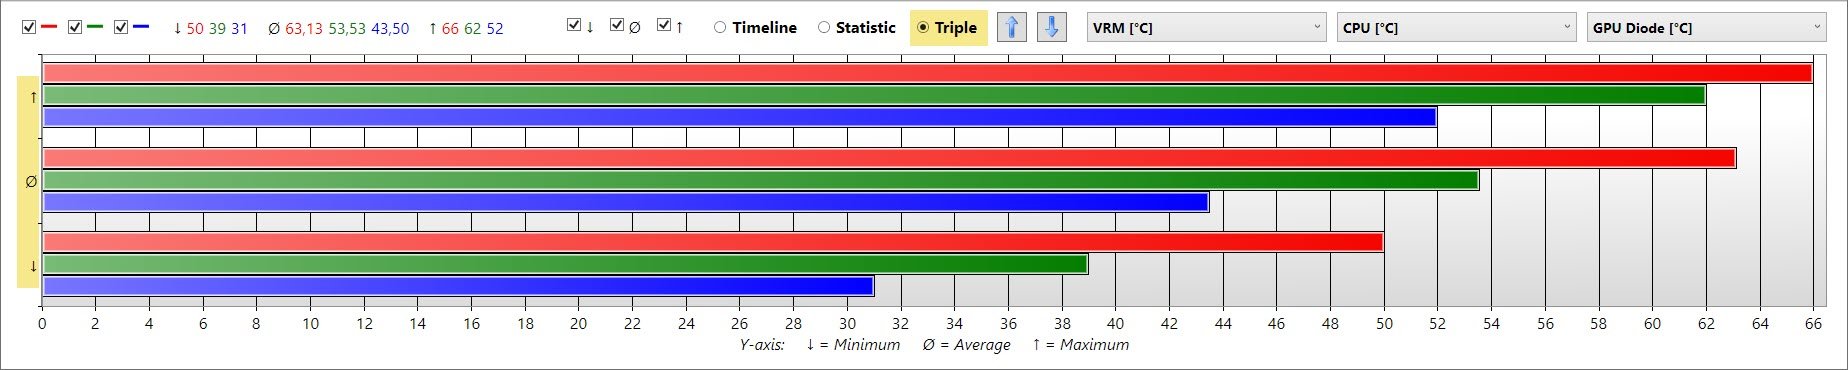
- New diagram-type "Triple" implemented, which shows Minimum, Average and Maximum in a barchart:

Attention:
"Generic Log Viewer" requires now at least .NET Version 4.7.2 (Windows Update from April 2018).
Download-Link: see first post of this thread ! -
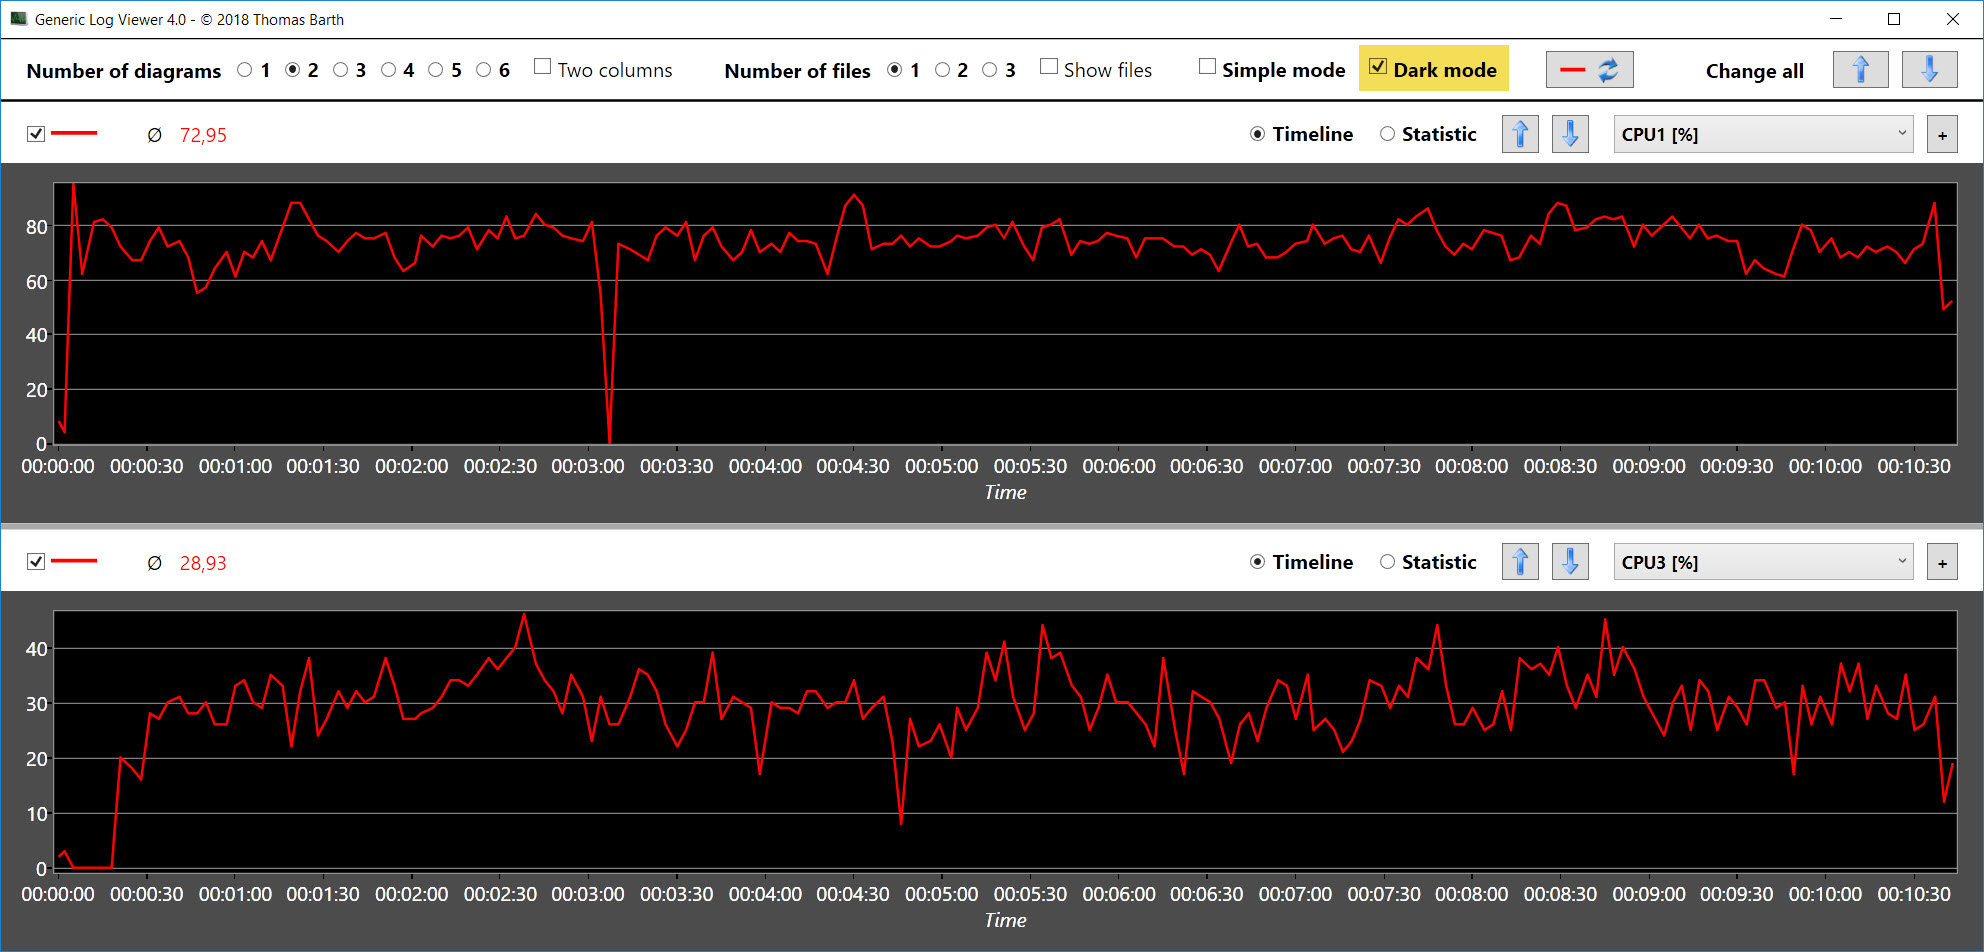
New version 4.0 available !
Hi all, I spent some time to improve the GenericLogViewer, so Version 4.0 has two new features:
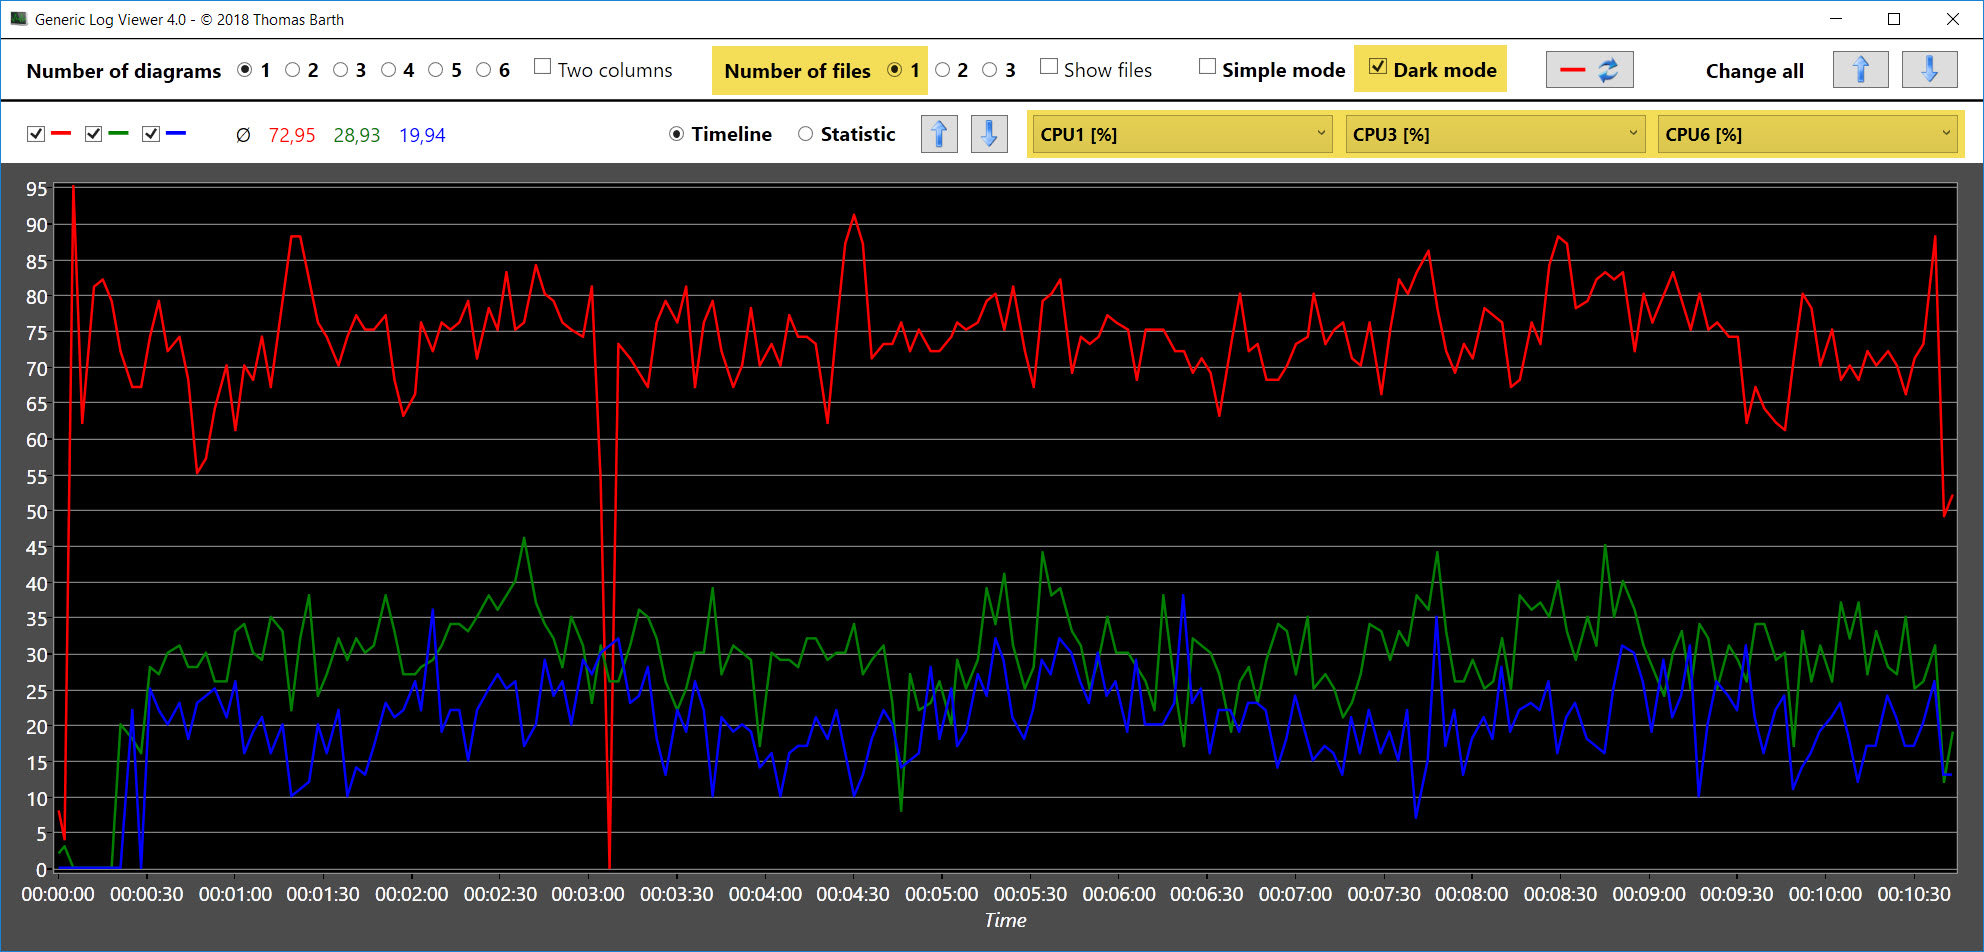
- possibility to compare different categories of one file in one diagram
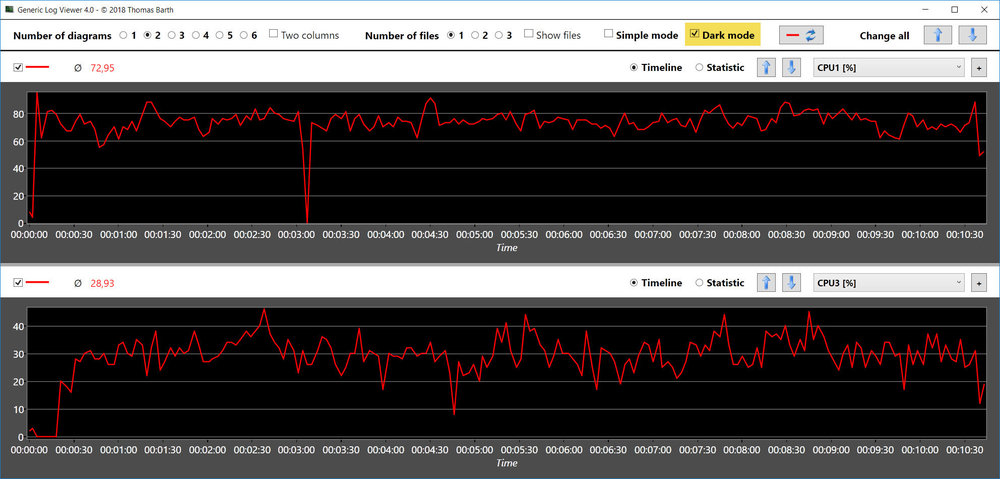
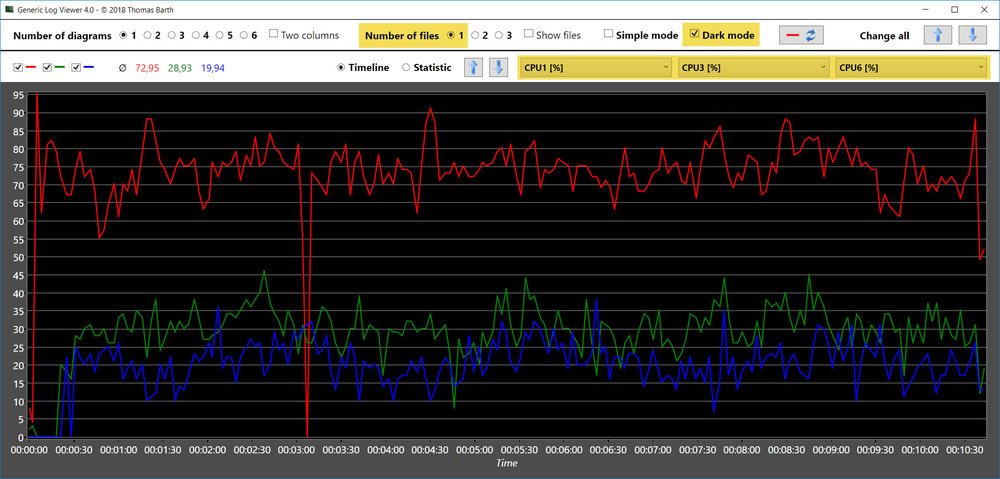
- possibility to present diagrams in a "dark style"
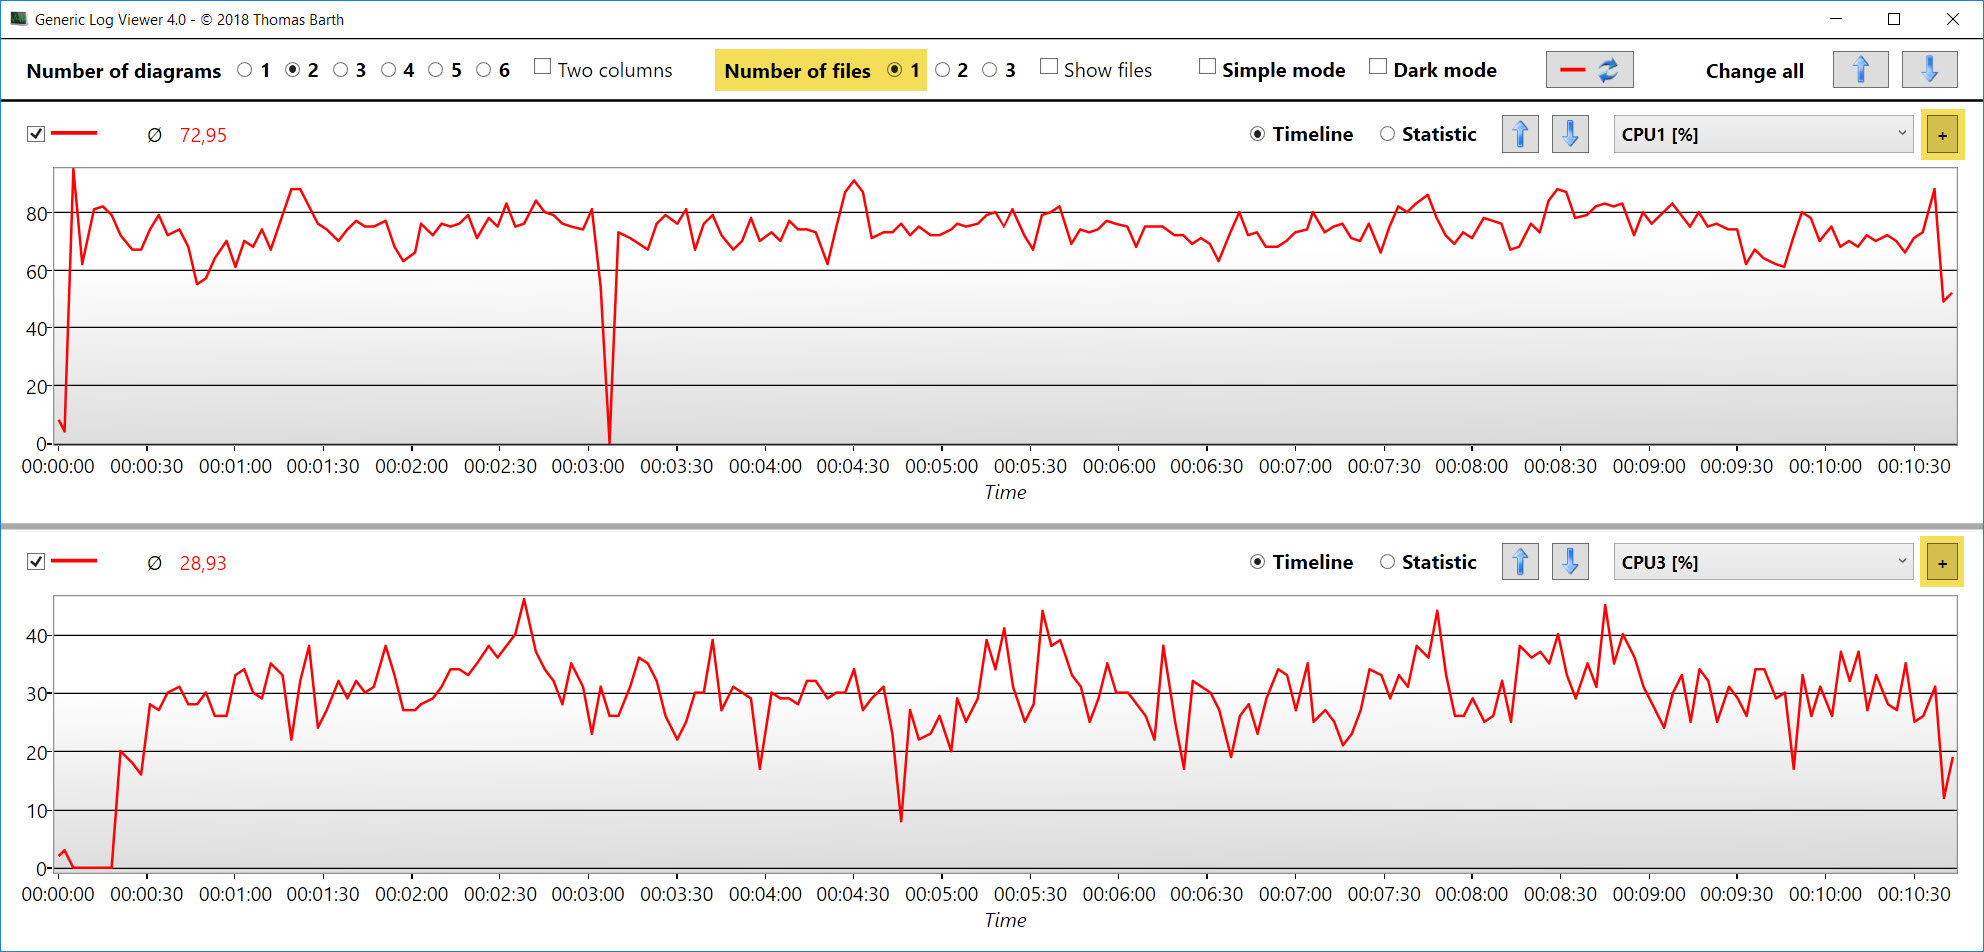
1) Multiple categories of one file in one diagram
If you have only one file loaded, you can find a new "+" button on the right side of the category ComboBox in every diagram:
This button allows you to add up to two more category ComboBoxes.
 Attention: be aware of comparing same units (within [..]) Comparing CPU [MHz] with CPU [%] doesn't make sense ... . You can reset the "number of category ComboBoxes" to one with the follwing trick:
- Select "number of files" = 2
- Select "number of files" = 1
2) Diagrams in a dark style
Together with YouTuber F2F Tech I developed a "dark style" for the diagram section. In the header of GenericLogViewer you can find a CheckBox "Dark mode" which enables/disables the dark style in the diagrams. Why not a complete dark style like "Metro Style"? I personally like the contrast between the control and diagram sections
... two more things:
- Upgrade from Visual Studio 2010 -> 2017
- Upgrade from .NET 4.0 -> 4.6.1 (released November 2015)
Hope you enjoy the new features ... Tom
-
New version 3.2 available !
Bugfix:Sometimes log-files can't be opened, case reported by mkos1 above -> fixed
-
Hello n1kobg,
you can typically see your FPS when you start FRAPS (http://www.fraps.com/) before you start AIDA64. If you do this, you can find in the log-settings an entry for FRAPS:
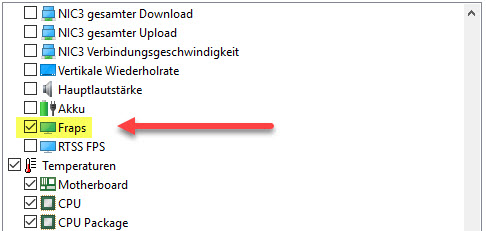
I think this works up to DX11 games, but not for games running with DX12 !
For Registry setting changes I propose you write registry files, which are simple text files (ask Google). The same for batch-files (simple text files, ask Google).
Best regards TomWoB
-
Hi mkos1,
I assume this should be not the problem. I checked the code and
- log lines like "* Processes started: dllhost.exe, Photoshop.exe" are handle correctly, but
- I found a potential problem in case of such a "Start/Stop" log-line contains the "value delimiter" semikolon (";"), but I never saw such a line so far !
Here is an example of a logfile, which has "Log started and stopped processes" turned ON and the LogViewer doesn't have any problem with this file:
-
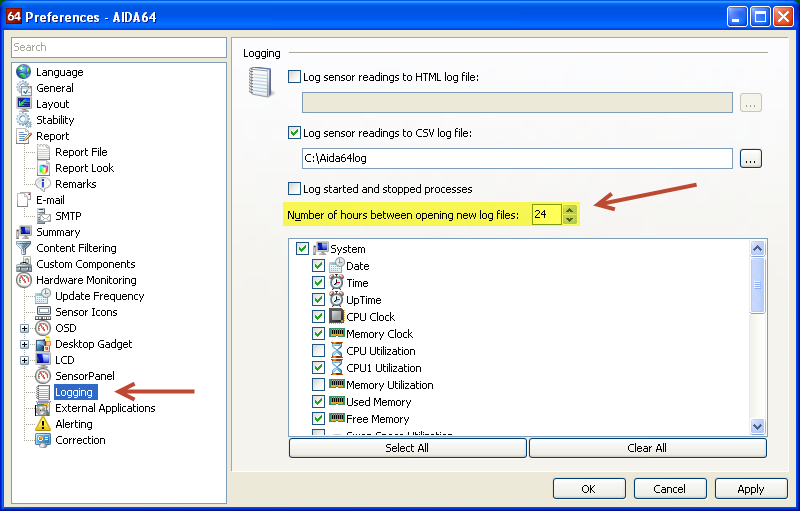
Hello mkos1,
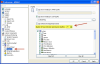
I'm sorry that you had some trouble with my LogViewer. Let's check some stuff: under menu "File -> Preferences" you should configure the "Logging" section like the following example (interface has a little bit changed):

The configuration filename "Aida64log" generates log-filenames like "Aida64log_2016-02-14_15-51-14_log.csv" !
Today I generated an example logfile (attached below) with the settings above:
- 00:00 - 00:26: Project Cars
- 00:27 - 00:47: F1 2015
- 00:47 - 00:51: nothing -> cool down
Everything is working fine on my PC: no problem during opening the file or during checking the diagrams ...
Btw: I can't believe that the LogViewer is responsible for "manipulated or corrupted" logfiles as you described. The LogViewer opens logfiles in "read-only* mode, so it will never change a file!
Example logfile (zipped): Aida64log_2016-02-14_15-51-14_log.zip
-
New version 3.1 available !
Bugfix:- Sometimes log-files can't be opened after AIDA64 was stopped -> fixed
-
New version 3.0 available !
New feature: time window definition per logfile possible:- to show only a part of a single logfile or
- to synchronize multiple logfiles
See detailed description in first post of this thread ...-
1
-
New version 2.2 available !Bugfix:Log-files, created on a PC which was running > 24 hours couldn't be loaded -> fixedTip:for "long time control" (e.g. PCs running 24/7), you can use the "Numbers of hours between opening new log files" feature, which allows to generate e.g. "one file per day". Such log-files can be perfectly compared, because
- all files have same duration
- arithmetic averages are calculated on same base
-
1
-
New version 2.1 available !
New features:
- up to 6 diagrams
- in up to 2 columns (-> max = 12 diagrams)
- Simple mode (for small diagrams)
- Tooltip with horizontal line
I added a "two columns" feature, which doubles the number of diagrams. But if you use "two columns" with a high "number of diagrams" the diagrams are very small. That's why I introduced the "Simple mode" which:
- simplifies header and footer
- decreases line thickness
Tip: use the "Tab"-key to toggle between 'Standard' and 'Simple' mode !
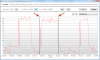
Another new feature is that you can create a horizontal line in a "Timeline" diagram:go with mouse "on curve where the horizontal line should be", wait until tooltip pops up (with value) and click -> line stays there until you click on another tooltip or you change category.Hope you enjoy my new features ... Tom -
New version 2.0 available !
New features:- Reload-Button: to refresh active logging-files
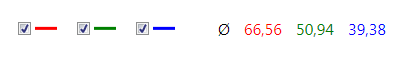
- arithmetic averages of all curves are shown
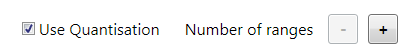
- quantisation can be disabled if wanted
Why new major version 2?I did a lot of internal changes and code is now completly verified by Unit-Tests. -
New version 1.3 available !
Information see above, please update to latest version.
-
Hi all,
please try my AIDA64-LogViewer, which can be downloaded in "3rd party solutions" section:
http://forums.aida64.com/topic/1368-logviewer-for-aida64-is-available/
Have fun ...
-
IntroductionI like AIDA64, especially the logging functionality, but it's difficult to analyze this data. The diagrams within AIDA64 are very limited and there is no possibility to compare the influence of different settings (e.g. graphic) to the overall performance of a system. So I decided to implement a tool,
- which allows to illustrate AIDA64 log data in several diagrams and
- to compare multiple log-files side-by-side in one diagram !
 User GuideBefore you can use the tool, you have to generate an AIDA64 log file with at least the following marked settings:
- Log sensor readings to CSV log file
- UpTime
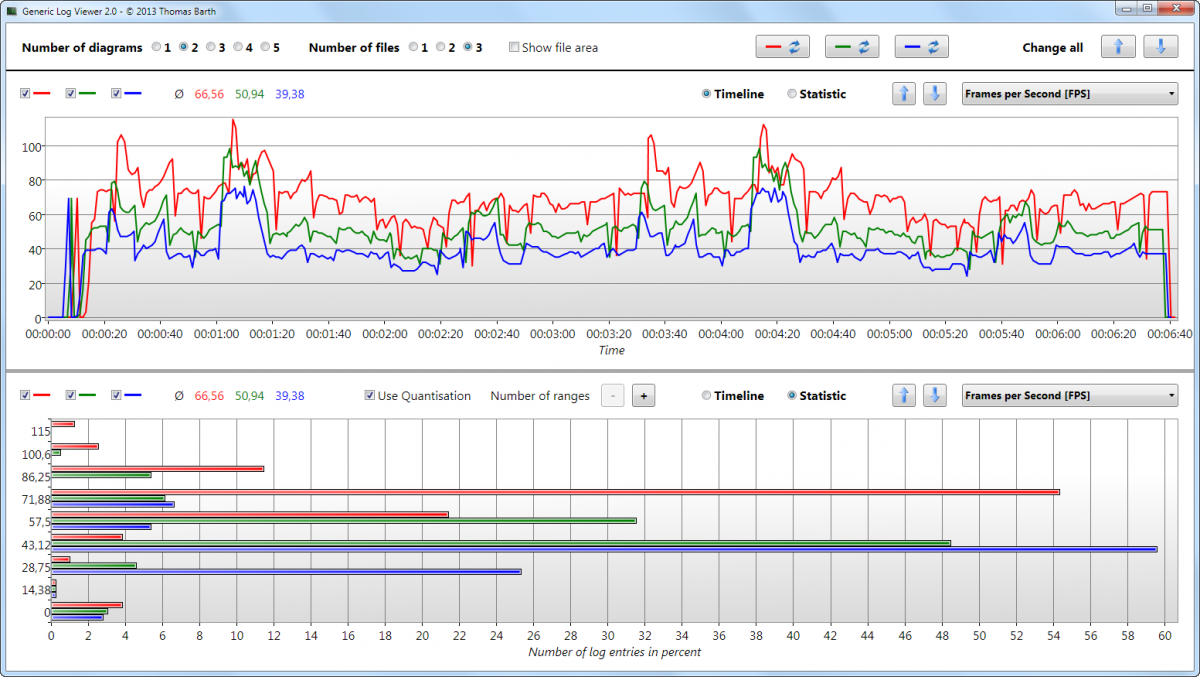
 The tool is very simple to use: no installation necessary, just start "GenericLogViewer.exe". At the top you can select
- how many diagrams with
- how many log-files
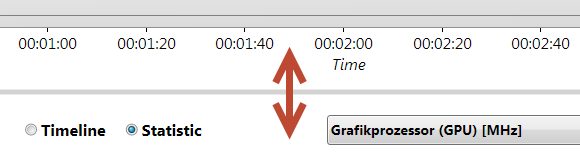
should be presented by the tool.Open an AIDA64 log file by clicking the "Open File" button, select application type "AIDA64", select an AIDA64 log file and press "Open" (AIDA64 csv-log-files have typically the filename pattern: *_log.csv). After parsing the file, the logging duration of the file is shown and by default the "Timeline" diagram of the first log category. You can change the shown diagram with:- Timeline/Statisic RadioButton
- Log Category ComboBox
- Change all buttons (changes category in every diagram)
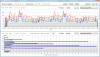
The Y-axis shows the values of the seleted Log Category in ComboBox (unit is within [..])If an opened file is still updated with logging-data by AIDA64, you can simple update/refresh it by clicking on the "Reload"-Button: At the top left corner of every diagram you can find the arithmetic average of the corresponding curve:
 If there are too many different values on Y-axis in "Statistic" mode, the values are grouped into ranges. If this is the case, the following control is shown, which allows to increase of decrease the number of ranges (or to disable quantisation).
 Splitter between the diagrams allow you to adjust the height of all diagrams:
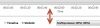 After opening all log files you can hide the file area by unmarking "Show file area" to get more space for diagrams.New feature since version 2.1: Simple ModeI added a "two columns" feature, which doubles the number of diagrams. But if you use "two columns" with a high "number of diagrams" the diagrams are very small. That's why I introduced the "Simple mode" which:
- simplifies header and footer
- decreases line thickness
Tip: use the "Tab"-key to toggle between 'Standard' and 'Simple' mode !
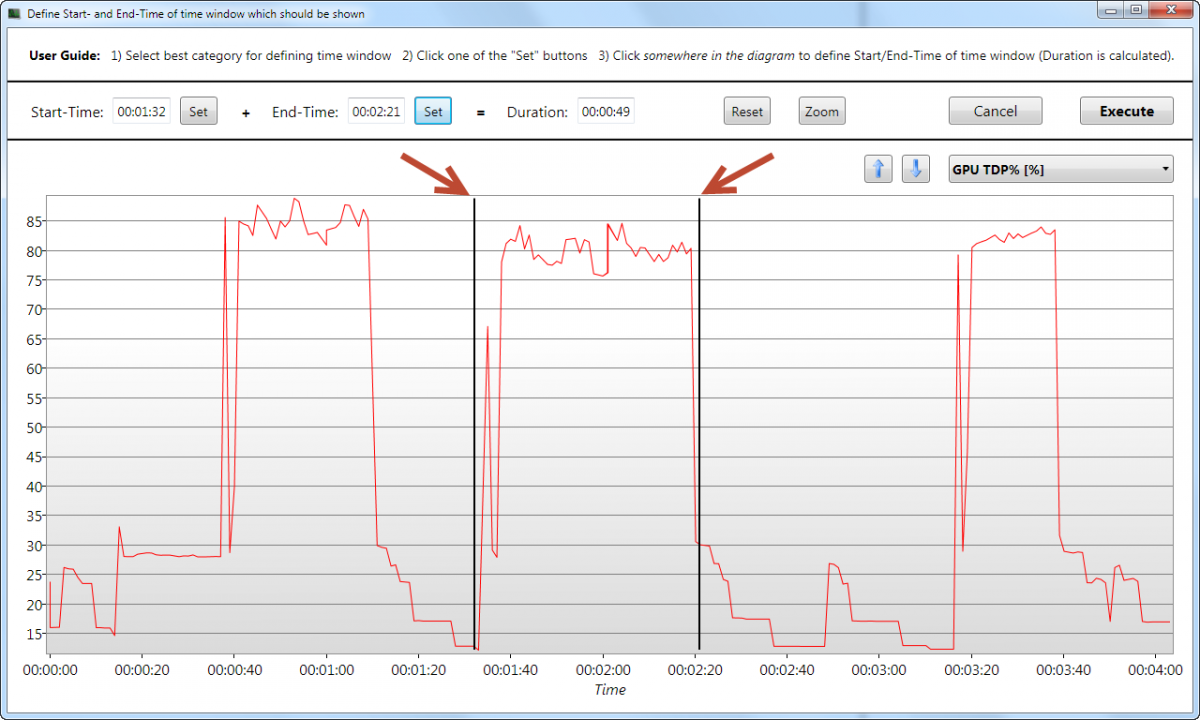
New feature since version 3.0: Time Window DefinitionIf you click the "Edit"-button in the file area, a new window will be opened to define Start- and End-time of a time window for the logfile (see user guide at the top of this window). It allows you- to show only a part of a single logfile or
- to synchronize multiple logfiles
Attention: time window start-time is "normalized" to "00:00:00", otherwise synchronization of multiple log-files will not work !Button description:- "Set": defines Start/End time of time window
- "Reset": resets Start/End time to "file borders"
- "Zoom": zooms into diagram with the actual defined Start/End times for fine-tuning (from Start-10% to End+10%). Remark: works only in case of Start/End is more then 10% from "file Start/End times")
- "Cancel": closes window without any change
- "Apply": yes, take the actual defined Start/End times as the used time window for all diagrams !
 New features since version 4.0 (August 2018):
- possibility to compare different categories of one file in one diagram
- possibility to present diagrams in a "dark style"
If you have only file loaded, it's now possible to add up to two more ComboBoxes for category selection in any diagram. Addtional you can change the background color of the diagram section to black.
New features since version 5.0 (July 2019):
- MSI Afterburner logs are now supported too (*.hml)
- "Statistic"-diagram got many improvements (now it works as it should)
- New diagram-type "Triple" implemented, which shows Minimum, Average and Maximum in a barchart:
New features since version 5.2 (November 2019):
- Ability to load/save setups of LogViewer
- Save Screenshot functionality
Requirements
- Microsoft Windows
- Microsoft Framework .NET 4.7.2 (at least, Windows Update from April 2018)
- no installation necessary, just start "GenericLogViewer.exe"
Download
The zip file (SHA-1 hash, Version 5.2: 9BA39AFDA2EE62B96289F5A08D35732ADA949546) contains the binary files of the tool.
Version history:- 1.0: Initial version
- 1.1: "Change log category" buttons added
- 1.2: User Interface improvements
- 1.2: Switch to GenericLogViewer
- 1.3: Bugfix: depending on Windows Region Settings there could be a problem during DateTime conversion (older versions)
- 2.0: Many internal changes, new features see post below
- 2.1: New features see post below
- 2.2: Bugfix: log-files, created on a PC which was running > 24 hours couldn't be loaded -> fixed
- 3.0: New feature: Time Window Definition
- 3.1: Bugfix: sometimes log-files can't be opened after AIDA64 was stopped -> fixed
- 3.2: Bugfix: sometimes log-files can't be opened, case reported by mkos1 below -> fixed
- 4.0: New feature: different categories of one file in one diagram and dark mode
- 5.0: New feature: diagram-type "Triple" implemented
- 5.1: New feature: save screenshot
- 5.2: New feature: save/load setups
-
3


LogViewer for AIDA64 is available !
in 3rd party solutions
Posted
Hi sanryana,
I know, but there is too less "traffic" in this forum (13 downloads). In other forums are thousands of downloads ...
So please google to find the latest version for download somewhere, tip: today was version 6.2 released!
BTW: AIDA64 is still full supported !
Regards
Tom