BeakersBro
-
Posts
2 -
Joined
-
Last visited
Content Type
Profiles
Forums
Events
Everything posted by BeakersBro
-
SensorPanel Manager doesn't allow graph of download rate
BeakersBro replied to BeakersBro's topic in Bug reports
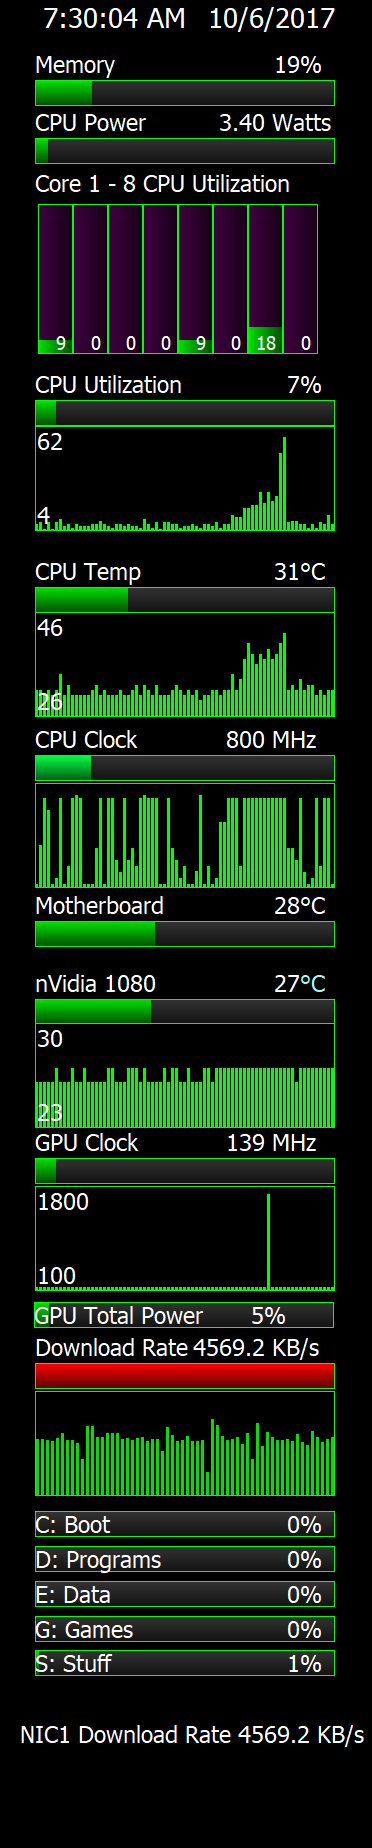
Thanks for the response. The NIC items as reported in Network/Windows Network page are correct. The Download Rate in simple sensor on sensor panel is correct. If I hand edit the graph in to the .sensorpanel the graph displays correctly. Attached is the graph (the bottom graph on the png) below that show BW usage during Steam loading updates. It matches my other bandwidth monitoring software and the bandwidth data looks correct.
-
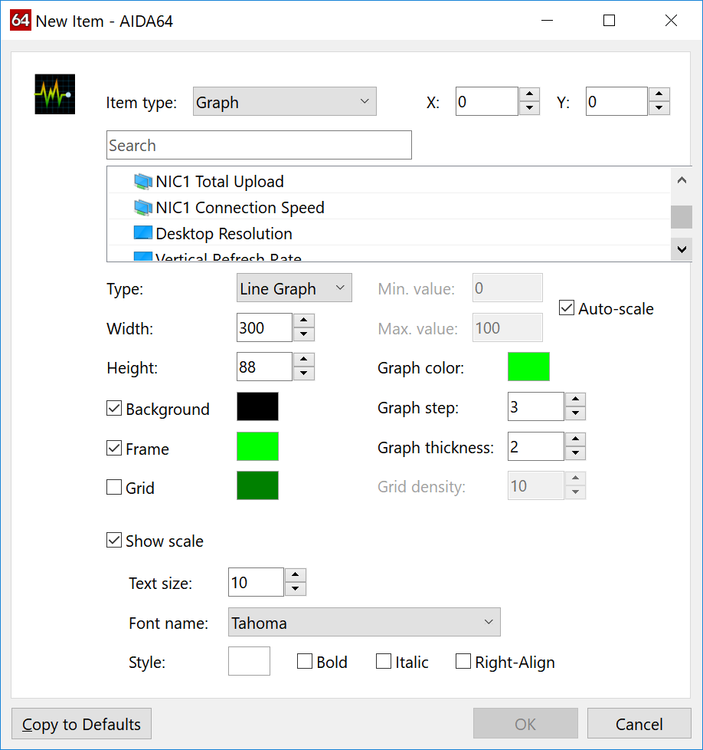
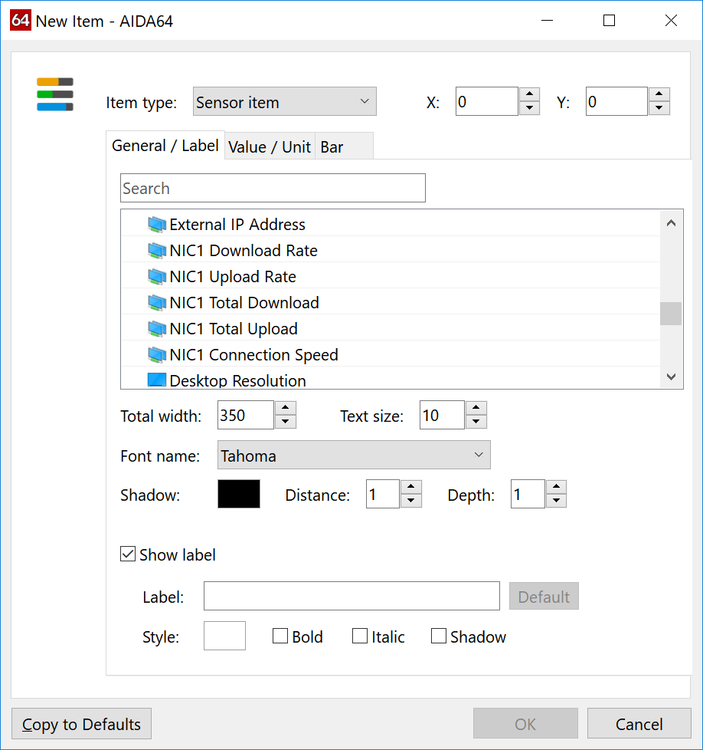
I went to update my old SensorPanel design. I the process, I deleted my old graph of current download rate and tried to setup a new one with my new defaults. If I create a graph, it doesn't show any network rate information on the item list - I only get connection rate and total download. If I do a simple sensor item, it shows up as a selection. So, I went into Notepad++ in the old exported sensorpanel file that had a working download rate graph, and cut and pasted the graph line for download rate into the new sensorpanel file and the graph shows up correctly in the panel. It appears whatever config file that determines what can be added to a graph is broken. I attached a couple of pictures to show what I am allowed to select. This is version 5.92.4300. Thanks!