ValhallasAshes
-
Posts
13 -
Joined
-
Last visited
Content Type
Profiles
Forums
Events
Everything posted by ValhallasAshes
-
CPU Utilization seems to be incorrect.
ValhallasAshes replied to ValhallasAshes's topic in Bug reports
I understand. I wasn't saying you were wrong. In fact, I would probably agree if wasn't for the fact that I don't know the formula for how you measure activity nor how that compares to the method everyone else uses. Not that I would technically understand the formula even if I saw it. But it also doesn't help that I can't corroborate your numbers because I don't know of a single other application that uses the same measurement method. So I can't understand because I don't know and I can't corroborate because nothing is shared/replicated between any third parties. Again, you're probably right and your formula is probably better. I have full faith and trust in that. I simply have no way to verify that internally nor externally. In the end though, it's not that big of a deal for me. Between my CPU cooler and the Aida64 sensor I can see both measurement methods anyway, but even so, I use it more for temps, RAM/VRAM usages, wattage monitoring and gaming frame rates. The only thing I use CPU utilization for is to see if and when an application hangs on black screen, failing to start or progress (used to happen a lot, not so much these days). Thanks again for the info and especially for the quick responses. It's really appreciated. -
CPU Utilization seems to be incorrect.
ValhallasAshes replied to ValhallasAshes's topic in Bug reports
No that's ok. They all hit 100% when all threads are loaded under Cinebench. It's just the utilization numbers in between that seemed wrong. Aida64 was the only app giving contradicting measurements from all the other programs I tested with and thought it was a bug. If you say it's because of differences in the formula used to measure utilization in Aida64, but that measurement is accurate, that's good enough for me. Although there is something to be said for being the only person using Fahrenheit in a room full of Celsius users. -
CPU: AMD Ryzen 7 9800X3D OS: Windows 11 23H2 AIDA64 version: 7.50.7236 Beta (needed this version as current mainline version doesn't support RTX 5080) I was configuring some fan curves today (recently did a wipe and was getting all my settings dialed in from fan curves to other things) and while testing my temps in a game loop in X4 Foundations I know can really drive CPU temps up, I noticed my CPU cooler was saying my CPU usage was anywhere from 30%-40% utilization. My CPU cooler is a Deepcool Assassin IV VC Vision, which has a screen with some various stats on it for the CPU (Temp, Utilization, Watts and Frequency). I didn't think anything of it, because 30%-40% sounded really normal under that kind of game load. But then I looked at my WigiDash display, which I have an AIDA64 sensor panel integrated into and in the CPU section, the load reading was only bouncing around 1%-3%. Sometimes a jump of 11%. I know what you're thinking, because it was the first thing I thought. I must have the incorrect setting in the sensor panel preferences. So that's the first thing I checked. I definitely have the correct one selected. There are 17 possible entries for my CPU in the list. The first one being "CPU Utilization", followed by listings for "CPU1 Utilization" - "CPU16 Utilization". Now I know it's not any of the 1-16 options because I actually have individual bars for each one of my cores/threads on my sensor panel. So not only can I see them, I can see each one of their behavior to tell they are not behaving abnormally (ie giving a reading more representative of overall utilization vs just one thread). So now I know I not only have the correct entry selected, but I have two different pieces of hardware reporting contradicting values for the same parameter. So I needed to figure out which one was wrong. I've now checked and compared the CPU utilization values in the Deepcool software for the cooler, my Lian Li L-Connect 3 software, CPUID HWMonitor, and Windows Task Manager Performance tab. Even the WigiDash's specific software is reading the correct value. All of them are showing the same values. The only software not showing the same value is AIDA64's sensor panel. I don't know if it's a known bug, or if it's an issue specific to the beta branch, but I thought I should report it. Not sure if this is the correct place to do it nor what format you prefer for bug reports. Hopefully I got it close enough.
-
Thank you Velkus. I really appreciate the share and the ping.
-
That's really good. Any chance you could share that one?
-
100
-
I would also consider RAM usage (utilization vs capacity) to be of high usefulness too.
-
Yes, system fan in my template is referring to my chassis fans as controlled by my Lian-Li L-Connect 3 software. I have no idea what that bar in the Fans & Pump section in the image you posted is for...Fan speed percentage maybe? Loop fluid temperature? Not sure, but it looks like filler to me. Probably just to not leave a blank space. As for what they did to their template as a whole, it simply looks like mine but with using the standard font instead of the GeForce font. Other than re-adding the date to the top bar and the changed fan/pump entries, it looks like a 1:1 of my template. I hope this helps.
-
This is really cool. My partner is going to love this one as she is a huge Fallout fan. My only critique is I wish you had used a generic brand neutral icon for the GPU section instead of the Nvidia logo. I have an Nvidia GPU, but my partner doesn't. It's for reasons like that I generally try to avoid hardware specific branding in sensor panels. But my partner would love this panel, so I'm going to have to try to find an alternative icon for that section for her. Thank you for sharing this panel. I know it sounds like I'm nitpicking, but you really have done a great job on it.
-
I actually found 4 variants of that display and posted a reply to him. But because I included direct links to the comments in this thread that have that display, it's stuck in a "waiting for approval" state.
-
That's the one from the Derbaur video. Yeah I tried to find that one too. Couldn't find it. EDIT: Found it! Google searched your image and found several versions of it: Do remember that Roman did say he customized it to his needs. So you're not likely going to find an exact match. But these are the ones that most closely match what you're looking for: https://forums.aida64.com/topic/667-share-your-sensorpanel/?do=findComment&comment=42963 https://forums.aida64.com/topic/667-share-your-sensorpanel/?do=findComment&comment=54446 https://forums.aida64.com/topic/667-share-your-sensorpanel/?do=findComment&comment=50178 https://forums.aida64.com/topic/667-share-your-sensorpanel/?do=findComment&comment=50543 I hope this helps.
-
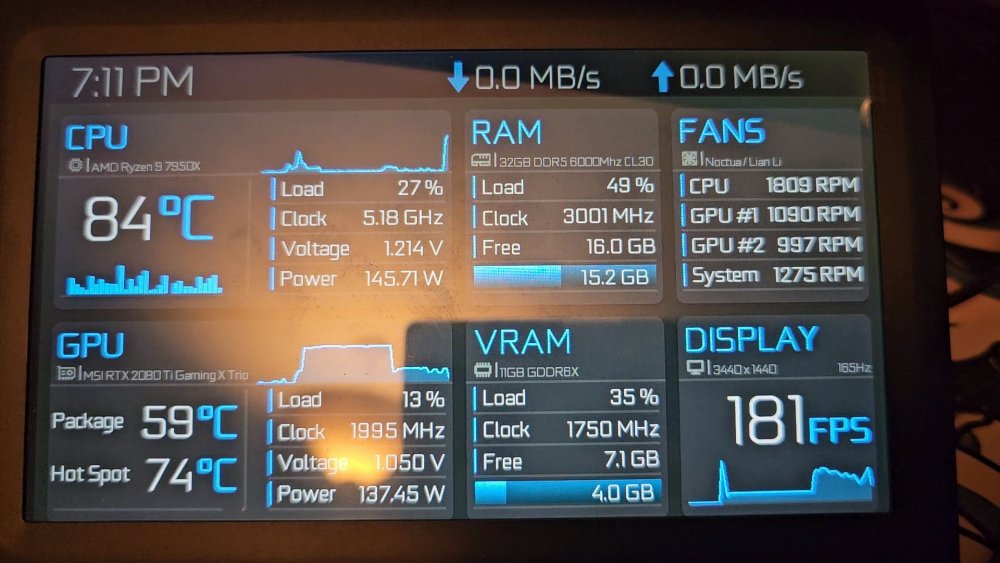
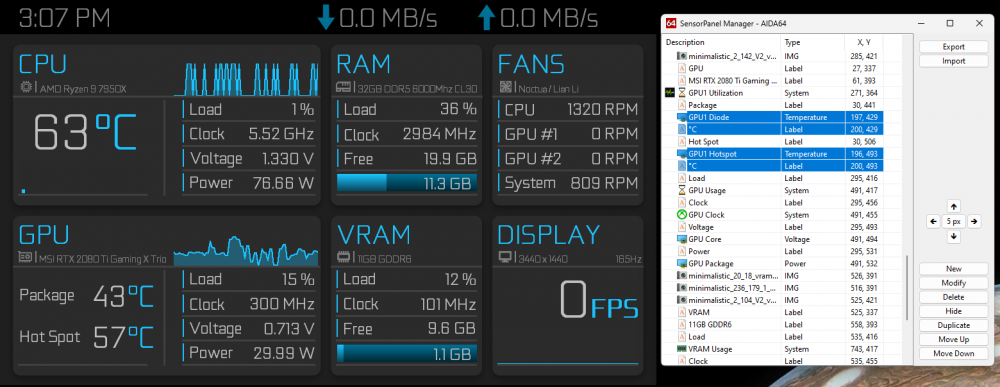
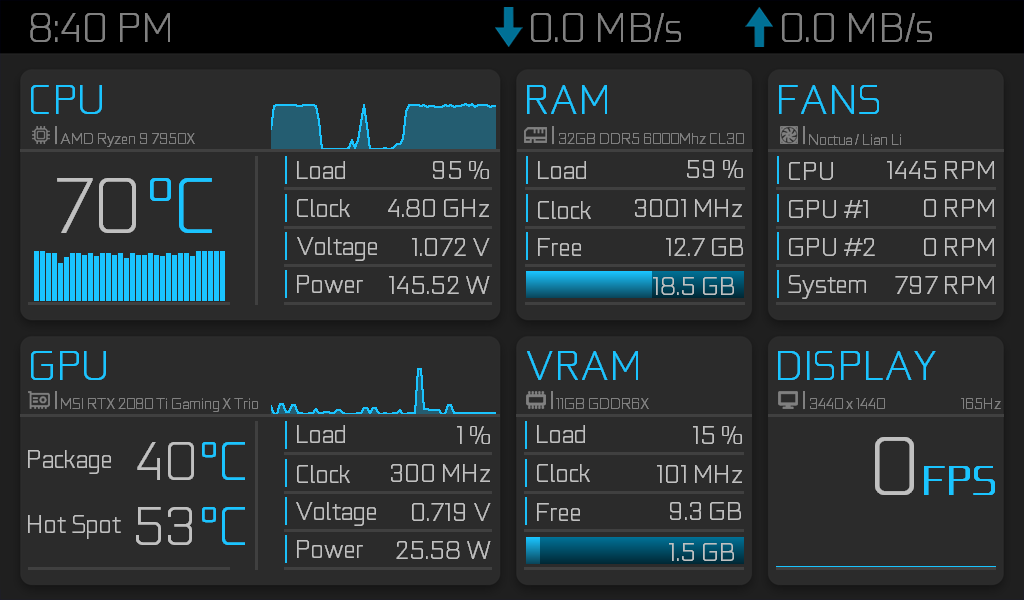
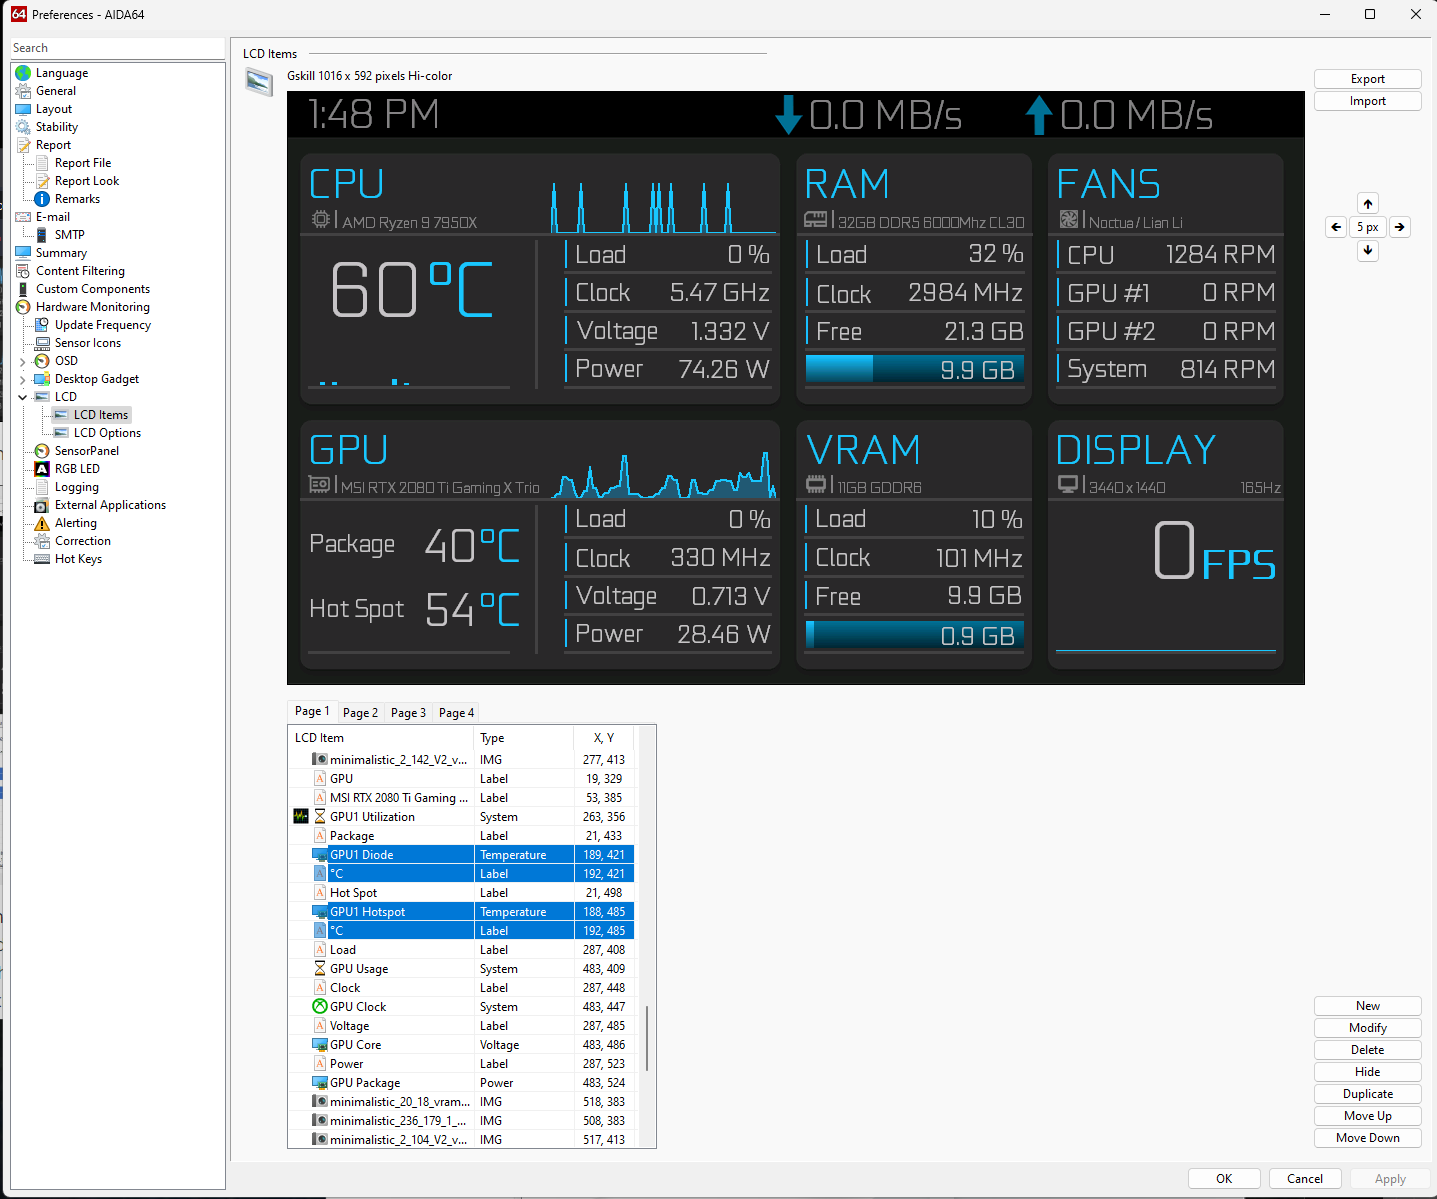
I hope you don't mind. I really liked your sensor panel, but needed it in a 1024x600 format to work with my G.Skill WigiDash. I used the 1920x1080 version as my baseline and I had to manually edit and touch up each of the elements to make it work with the smaller screen. I did make a few alterations to better suit my needs though. Such as I didn't really need to have the min/max icons and info for the CPU and GPU. So in the CPU section, I replaced those with individual skinny bars for each of the logical threads on my CPU. So on the top right, I kept the area graph for the overall CPU usage, but under the CPU temp, I have usage bars for all of the CPU cores/threads. And in the GPU section, I traded the min/max temp identifiers for a GPU Hotspot reading. I had a recent issue with my GPU where the package reading kept saying the GPU was operating at safe temps, but my GPU would constantly over rev at full pelt. It wasn't until I checked the Hotspot temp that I found the GPU had a Hotspot temperature delta of well over 40 degrees hotter than the package temp. For reference, the Hotspot should be less than half that delta. A massive difference that it never should've been, pushing the GPU to well over 100 degrees under full load. That information, had I known it earlier, would've prompted me to replace the thermal paste years ago, but due to my only knowing about the standard temp reading, I relied on that reading to assume that the card was operating normally even though my gut told me something was wrong. Even MSI when I called them about it, told me it was probably just a defective sensor. Turned out the opposite was true. The card knew exactly what was wrong. Afterburner just never showed that sensor's reading to me. Replacing the thermal paste fixed that issue and the card now runs the way you would expect it to. Thankfully due to my paranoia during the issue, as a precaution, I ran the GPU for years undervolted to keep the fans from over revving. That must've been just enough to keep the card from cooking itself to death until I could find the cause of the problem. As a result of that experience, I now consider the hotspot temp to be a critical piece of information. So I replaced your min/max values with that reading instead. I saw someone else asking for the 1024x600 version of your minimalist sensor panel, but for the life me, I can't find it again. So I thought I would post it here in case anyone else wanted it. I hope you don't mind. As mentioned, I originally needed this for my G.Skill WigiDash sensor panel. Before anyone asks, no I don't have two GPUs. My GPU simply has two separate fan controllers. Hence the two GPU fan readings. I'm going to upload two different files. One is the standard 1024x600 version of the sensor panel and you will be able to know which one it is by it having the .sensorpanel extension at the end of it's file name. The other file I'm going to upload is a version specifically for the G.Skill WigiDash and you will be able to know which one it is by it having the extension .gslcd at the end of it's file name. While yes, technically both files can be imported and will work for either the standard sensor panel function or Wigidash (LCD section of Aida64), the reason I've done two versions is due to a technical discrepancy between what G.Skill marketed the screen's resolution to be and what Aida64 detects the screen's resolution to be. G.Skill originally advertised the WigiDash to have a resolution of 1024x600, but in practice, Aida64 recognizes the screen as having a resolution of only 1016x592. A discrepancy that does affect the alignment of the sensor panel on the WigiDash screen. So the .gslcd WigiDash version of the file includes offsets to compensate for the resolution mismatch to fix the panel's alignment. So make sure to download the version that's appropriate to your use case. Standard version (Final revision): Blue_Minimalist_1024x600_Rework.sensorpanel WigiDash version (Final revision): Blue_Minimalist_1024x600_Rework.gslcd GeForce Font: geforce_light.otf Thanks again to VeilSide for creating this incredible sensor panel. It's exactly the style I was wanting and with a few tweaks, it has all the information I wanted. Simple, clean, informative, looks great while being organized and easy to read. And completely unbranded. I love it. Great job Veilside, and I hope you don't mind me sharing a modified version of it. EDIT: Found a couple text misalignments. Fixed them and updated the files in this post. Also posted the GeForce Font file. Forgot to include that in the original post. EDIT 1/16/24: Adding this as a recommendation. The GPU package and hotspot temp reading felt way out of proportion to the elements around them. They were just way too big. So I've rescaled and realigned them a little to make them look better within the overall panel. Because I know most people edit all of the hardware titles and certain other elements to conform to their personal rig's specifications, I thought it would be easier for everyone who wants it to simply edit the 4 elements themselves rather than downloading new files and having to re-edit all of their hardware stats. So for those who've already downloaded the above files, here's some screenshots highlighting the 4 elements changed and those who want to can update their panels themselves relatively quickly: Standard Version: WigiDash Version: Simply change those four elements text size to 36 instead of 42 and adjust the x,y coordinates to match those shown in the image. Oh, and I also indented the Package and Hot Spot titles in a little bit. Their new x,y coordinates are also visible in the images. Then export to your chosen file to permanently save it. For those of you who'd rather just download the updated files without having to update them yourselves, I've already updated the main files so new downloaders get the latest version. Sorry if this update caused any confusion. It was just bugging me, and my OCD made me fix it. This will probably be the last update I do for this panel unless I think of a major change I want to make. But if that happens, I'll just make a new post next time instead of updating this one again. Maybe a different color like red, green, or purple. I kinda think a yellow/orange/gold version of this panel might look really good. I'll consider it if I have time.