


790
-
Posts
47 -
Joined
-
Last visited
Content Type
Profiles
Forums
Events
Posts posted by 790
-
-
Pause panel updates in full-screen mode it`s good! I would also like pause panel updates when screen in powersave mode aka sleep mode or screen-save mode... when no one looks at the screen 😀
-
Preferences->Hardware Monitoring->Decimal digits for power values 0
-
I would like to see "round values" without decimal for NIC Download/Upload Rate in Mb/s in SensorPanel also.
-
RTSS Overlay Editor will show the 1% low and the minimum FPS without AIDA. Read on Guru3D forum.
-
After switchig The embedded controller (EC) ON for T_sensor, I have this warning in syslog after every reboot:
ACPI : the embedded controller (EC) returned data when there was no request for it. The BIOS tries to access the onboard controller without synchronizing with the operating system. This data will be ignored. No action is required, but it is recommended that you contact your computer manufacturer to obtain an updated BIOS version. (approx. translation from my language)
I have ASUS-ROG-z790 MB. I don't use "SMBus through ACPI (Asus MB)" because then I'll lose DIMMs temp. I have not any drivers or programs from ASUS installedI in my system (Win10x64 LTSC), so "Asus ATKEX support" and "Asus WMI support" are turned off.
-
Why AIDA shows 2 different temp.sensors from PSU Corsair RM850i? iCUE shows only one.
And AIDA shows FAN speed of this PSU in RPM, can you do it in %? I can`t set right corrections, cos max. = 1500rpm, but 50% = 900rpm.
-
btw. AIDA64 can see these 2 sensors in nVidia SMB dump:
------[ Chips Found ]------ GPU1-B04-D15: Nuvoton NCT3933U GPU1-B04-D29: ITE IT8915FN GPU1-B04-D68: ITE IT8915FN -
Is it possible to monitor these additional fans on graphic card ASUS GTX1080 Strix? These control by iTE 8915FN-56 chip and ASUS GPU Tweak III app. AIDA64 6.88 doesn't see those fans.
-
Also, I have 2 SSD in RAID-0 on 2 SATA-3 ports and 2 HDD in RAID-0 on 2 SATA-2 ports - all on one Intel Z77 chipset with Intel OROM and driver.
I see in AIDA in ATA-window
Before Sleep mode :
Max. MWDMA Transfer Mode MWDMA 2
Max. UDMA Transfer Mode UDMA 6
Active UDMA Transfer Mode UDMA 6After wake up from Sleep mode:
Max. MWDMA Transfer Mode MWDMA 2
Active MWDMA Transfer Mode MWDMA 1
Max. UDMA Transfer Mode UDMA 6
on SSDsand
Max. MWDMA Transfer Mode MWDMA 2
Active MWDMA Transfer Mode MWDMA 0
Max. UDMA Transfer Mode UDMA 6
on HDDs
what`s this?

P.S.
This "problem" occurs after AIDA restart after resume from Sleep Mode (including hibernation).
I think, AIDA displays the wrong result, because I did the disk benchmark (AIDA Read Test Suite) after - there is no difference in speed!
-
Asus Maximus V Gene, z77 chipset
Win10pro 64
-
When the comp wakes up from Sleep mode (including hibernation or not), the PCH diode temperature sensor on the sensor panel shows N/A and there is no sensor in the AIDA sensor window. This problem is only in Win10 (64). There is no problem in Win7. I need to restart AIDA again and it`s OK.
AIDA64 Extreme 6.60.5900
-
Modern systems have many similar components such as SSDs, HDDs, Cores, etc. Output to OSD or external applications of a large number of parameters from the same type of devices is inconvenient (for example: the temperature from 3 SSDs installed in one place - will have 3 similar values). I suggest adding more math options in Preferences->Corrections:
+, -, *. / between the same types of sensors.
e.g. (1): I`ve 2 SSD or 2 HDD in RAIDs and I want average:
I select t° from SSD 1, t° from SSD 2... t°8
(t°1 + t°2+...t°n)/n=new Tgen. - on OSD, External, SP, etc.
e.g.(2): I`ve 2 or more of power sensors (e.g CPUs and GPUs) and I want to see the "general" power:
I select power sensor 1, 2...8
p1 + p2+...p8=new Pgen. - on OSD, External, SP, etc.
-
wow thanks... while everything works fine
")
-
I have consumption in TDP (%) in AIDA. It's not very convenient. But I'm using the correction TDP x 1.32 ratio. (Preferences->Correction). And I`ve change the sign % to W for my language. This is the easiest way
")
But I think, this ratio is specific to each graphics card and each user must calculate this value himself.
Therefore, my suggestion: dual value of consumption (TDP% and W) like GPU-Z or the possibility of choice something one by user, that better
-
Of course, I did.
I see the item in Sensor Panel settings, but it does not show in SP
-
Nothing in 5.98.4832 beta , after restart too
I don`t see ID in register
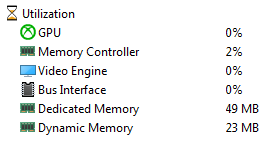
GPU-Z shows 9% (max), AIDA window shows 1% ... but it`s current when alt-tab from game
Asus GTX960, Win 7

-
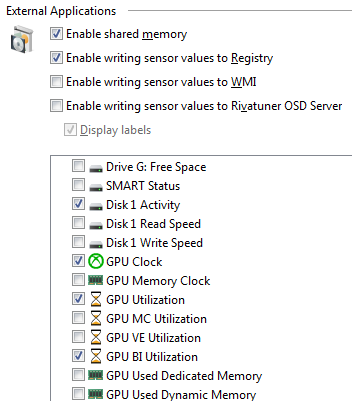
Please, add a ID key (checkbox) for GPU Bus Interface Utilization (%) in Preferences -> External Applications
-
I can't say about fixing the issue or not, because I don't look out the AIDA-window 24/7. I'm just trying to figure out whose issue it is...AIDA or my memory, comp, OS etc.
-
Win 7-64 Ultimate SP1
info from AIDA: 6.1.7601.18409 (Win7 RTM)
-
szia, hej
Sorry if I don't understand the topic.
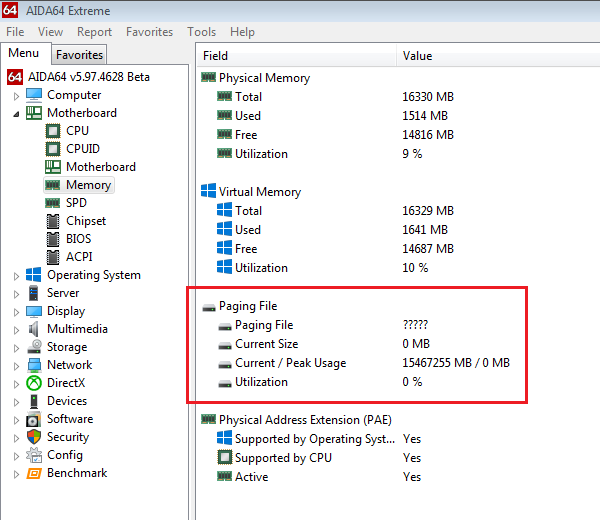
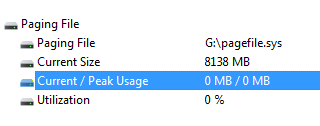
I had 8gb (2x4gb) memory and pagefile on 8gb, now I added 8gb(now 8+8 (2x4)gb, dual mode) memory and deleted pagefile completely.But what`s this? It appears for 0.3 seconds and disappears again. I can't understand the cause and frequency of occurrence.
-
also need ID for graphics card Bus Interface Utilization
-
I'd like to see this 3 keys for External App:
Paging File: Current Usage (Mb), Peak Usage (Mb), Utilization (%)
If this is possible. Thanx
-
I have SMART values translation for my language and tried adding lines to the end of my lang_xx file, but it doesn't work
 How can I do that?
-
Yes, I`m administrator and UAC switch off.
Also, this problem was in previous 3542
SensorPanel: Pause panel updates when monitor in powersave mode
in Brainstorming
Posted
Of course, this is not applicable with the graphs... but this is good if there are no graphs. And existing "Pause panel updates in full-screen mode" is also not suitable for the graphs.