gbohn
-
Posts
24 -
Joined
-
Last visited
Content Type
Profiles
Forums
Events
Everything posted by gbohn
-
Not seeing SMART data for Sandisk Extreme Pro 4 TB
gbohn replied to gbohn's topic in Hardware monitoring
For what it's worth, the USB attached drive can also be queried by smartmontools 7.4 with the option "-d sntasmedia". C:\Program Files\smartmontools\bin>smartctl --scan /dev/sda -d ata # /dev/sda, ATA device /dev/sdb -d ata # /dev/sdb, ATA device /dev/sdc -d ata # /dev/sdc, ATA device /dev/sdd -d ata # /dev/sdd, ATA device /dev/sde -d nvme # /dev/sde, NVMe device /dev/sdf -d nvme # /dev/sdf, NVMe device /dev/sdg -d scsi # /dev/sdg, SCSI device /dev/nvme0 -d nvme # /dev/nvme0, NVMe device C:\Program Files\smartmontools\bin>smartctl -d sntasmedia -x /dev/sdg smartctl 7.4 2023-08-01 r5530 [x86_64-w64-mingw32-w10-22H2] (sf-7.4-1) Copyright (C) 2002-23, Bruce Allen, Christian Franke, www.smartmontools.org === START OF INFORMATION SECTION === Model Number: WD_BLACK SN850XE 4000GB Serial Number: XXXXXXXXXXXX Firmware Version: 624131EX PCI Vendor/Subsystem ID: 0x15b7 IEEE OUI Identifier: 0x001b44 Total NVM Capacity: 4,000,787,030,016 [4.00 TB] Unallocated NVM Capacity: 0 Controller ID: 8224 NVMe Version: 1.4 Number of Namespaces: 1 Namespace 1 Size/Capacity: 4,000,787,030,016 [4.00 TB] Namespace 1 Formatted LBA Size: 512 Namespace 1 IEEE EUI-64: 001b44 8b4e35d3c7 Local Time is: Sat Aug 26 12:51:46 2023 EDT Firmware Updates (0x14): 2 Slots, no Reset required Optional Admin Commands (0x0017): Security Format Frmw_DL Self_Test Optional NVM Commands (0x00df): Comp Wr_Unc DS_Mngmt Wr_Zero Sav/Sel_Feat Timestmp Verify Log Page Attributes (0x1e): Cmd_Eff_Lg Ext_Get_Lg Telmtry_Lg Pers_Ev_Lg Maximum Data Transfer Size: 128 Pages Warning Comp. Temp. Threshold: 91 Celsius Critical Comp. Temp. Threshold: 94 Celsius Namespace 1 Features (0x02): NA_Fields Supported Power States St Op Max Active Idle RL RT WL WT Ent_Lat Ex_Lat 0 + 9.00W 9.00W - 0 0 0 0 0 0 1 + 6.00W 6.00W - 0 0 0 0 0 0 2 + 4.50W 4.50W - 0 0 0 0 0 0 3 - 0.0250W - - 3 3 3 3 3100 11900 4 - 0.0050W - - 4 4 4 4 3900 45700 Supported LBA Sizes (NSID 0x1) Id Fmt Data Metadt Rel_Perf 0 + 512 0 2 1 - 4096 0 1 === START OF SMART DATA SECTION === SMART overall-health self-assessment test result: PASSED SMART/Health Information (NVMe Log 0x02) Critical Warning: 0x00 Temperature: 26 Celsius Available Spare: 100% Available Spare Threshold: 10% Percentage Used: 0% Data Units Read: 37,733,981 [19.3 TB] Data Units Written: 19,431,008 [9.94 TB] Host Read Commands: 305,046,289 Host Write Commands: 156,068,064 Controller Busy Time: 222 Power Cycles: 62 Power On Hours: 79 Unsafe Shutdowns: 12 Media and Data Integrity Errors: 0 Error Information Log Entries: 0 Warning Comp. Temperature Time: 0 Critical Comp. Temperature Time: 0 Warning: NVMe Get Log truncated to 0x200 bytes, 0x200 bytes zero filled Error Information (NVMe Log 0x01, 16 of 256 entries) No Errors Logged Warning: NVMe Get Log truncated to 0x200 bytes, 0x034 bytes zero filled Self-test Log (NVMe Log 0x06) Self-test status: No self-test in progress No Self-tests Logged -
Not seeing SMART data for Sandisk Extreme Pro 4 TB
gbohn replied to gbohn's topic in Hardware monitoring
For what it's worth, this is the same with version 6.90.6500 (not reporting the SMART values for those devices). -
Not seeing SMART data for Sandisk Extreme Pro 4 TB
gbohn replied to gbohn's topic in Hardware monitoring
Fiery; Hi. Did the data I attached above provide the information you needed? Do you need anything else? Thanks; -Greg -
Not seeing SMART data for Sandisk Extreme Pro 4 TB
gbohn replied to gbohn's topic in Hardware monitoring
Here is the data you asked for. I did it one set with the 4 TB Sandisk Extreme Pro attached and another set with the 2 TB Sandisk Extreme attached. I also noticed that after doing this, I was unable to 'safely eject' the drive as it said it was still in-use. After ending Aid64 I could eject it normally. For what it's worth, originally these would start up with two drive letters visible (one as UDF for use to unlock the drive if you used their hardware encryption and one ExFAT for the data itself.). I reformatted these as NTFS and now I think I only see the one logical drive letter when they are attached. Thanks. diskctrldump-2tb.txt raiddump-2tb.txt smartdump-2tb.txt diskctrldump-4TB.txt raiddump-4tb.txt smartdump-4TB.txt -
Not seeing SMART data for Sandisk Extreme Pro 4 TB
gbohn replied to gbohn's topic in Hardware monitoring
I just noticed the same thing with a "Sandisk Extreme 2 TB" SDSSDE61-2T00. It shows up in Aida 64 under physical disks, but does not show under SMART data. CrystalDiskInfo shows smart data for a "Western Digital SN550E : 2000.3 GB" -
Hi; I just got a USB-C attached 'Sandisk Extreme Pro Portable SSD' external drive. Model SDSSDE81-4T00 / RN SA3B. It shows up in Aida 64 6.88.6400 under Storage/Physical drives, but not in Storage/Smart. I see that this will show smart data under CrystalDiskInfo as a "WD_BLACK SN850XE 4000GB", Firmware 624131EX for what it's worth. Can this be made to show smart data in Aida64? Since this drive type has been dying on people I was hoping to see the Smart data displayed in Aida64. Thanks; -Greg
-
Hi; I was just trying out MS 'Storage Spaces' on WIndows 10 (1803). I noticed that after I set up a new pool (as logical Drive E:) that the drive in the pool no longer shows its S.M.A.R.T. data in AIDA64 (it's no longer listed in 'Storage/Smart'). Is this expected? Currently, there is only this one drive in the ('simple') pool, a Samsung 850 Pro 512 GB drive. It showed up in AIDA64 SMART before I put it in a (the only) Storage Spaces pool. I can see still see an entry for the 850 Pro 512 GB drive under 'Storage/Windows Storage', 'Storage/Physical drives' and 'Storage/ASPI' There does not appear to be an entry for the physical drive itself under 'Storage/Logical drives' (Just the pool space as E:), or 'Storage/ATA' (Just the pool space as E:), This is with AIDA64 Extreme 5.99.4900. Just for fun I ran HWINFO, and it seems to be able to show the SMART data for the physical drive even thought it is part of a 'Storage Spaces' pool. It would be nice if I could still see the SMART data for drives in a Storage Spaces pool (with AIDA64). Thanks;
-
Xeon E5-1650 v4 core speeds (Asus X99-E WS/USB 3.1)
gbohn replied to gbohn's topic in Hardware monitoring
> I'm not sure why the CPU drops to 3.50 GHz... For what it's worth, I found a program named 'Throttlestop' which has a display panel that is supposed to display the reason for a CPU throttle. On my system, when throttling to 35x, it indicates 'Core P1' as the reason. I'm not entirely sure what that is, but at first blush this seems as thought it might be different than the overall power limit. The BIOS has the 'Long duration' and 'short duration' power limits set to 'Auto', but they might be for a different limit. Any idea what a Xeon 'Core P1' throttle indicates? Thanks; -
Xeon E5-1650 v4 core speeds (Asus X99-E WS/USB 3.1)
gbohn replied to gbohn's topic in Hardware monitoring
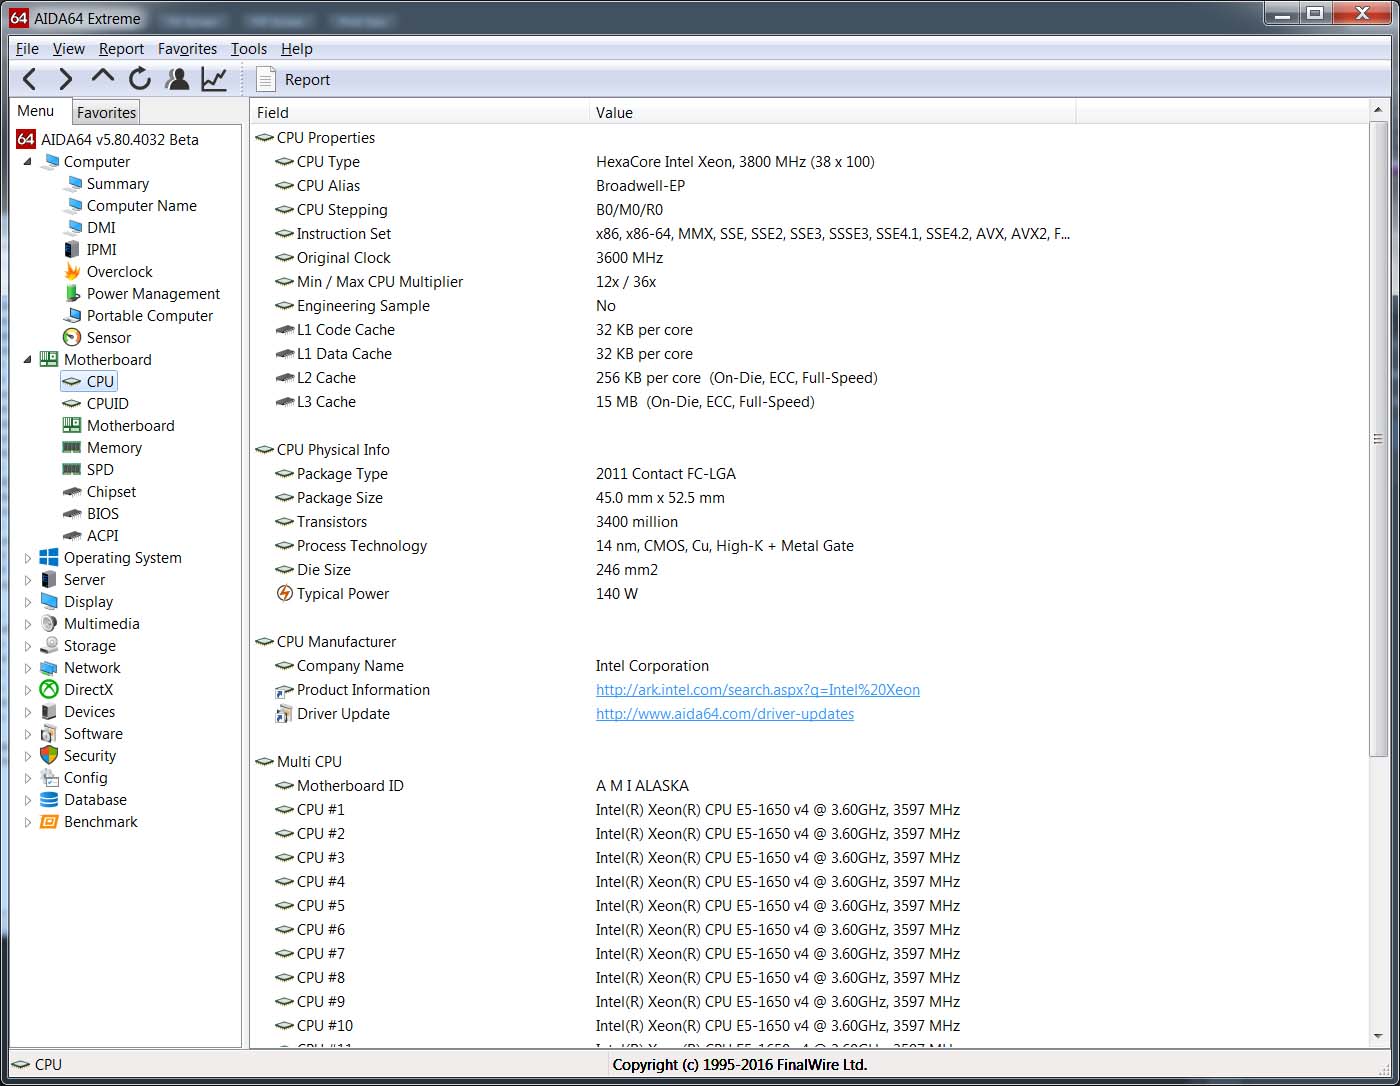
Thanks. I looked at the AIDA64 CPUID page, and I see something similar. Aside from the core voltage reporting bug, I see that here too my reported core frequency (apparently for all the cores that I tried) drops below the 'base frequency' under heavy load. At light load I see around 3800 Mhz, but under heavy load I see about 3500 MHz. Would this be the expected results for a '3600 Mhz' base frequency? (I was thinking that the base frequency would be maintained under load) This happens right after increasing the load, and the reported CPU package temp is 62 C (with the highest individual core temp at least 4 C lower), so I assumed that this wasn't hot enough to cause an issue. Thanks.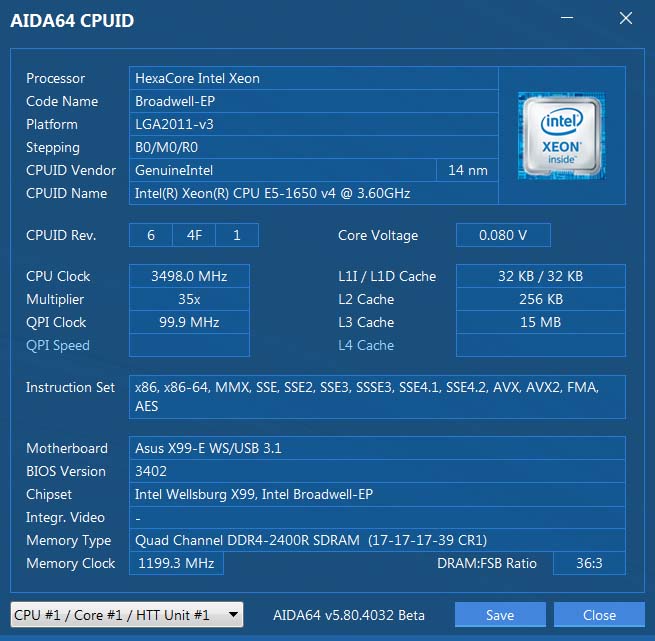
-
Xeon E5-1650 v4 core voltage (Asus X99-E WS/USB 3.1)
gbohn replied to gbohn's topic in Hardware monitoring
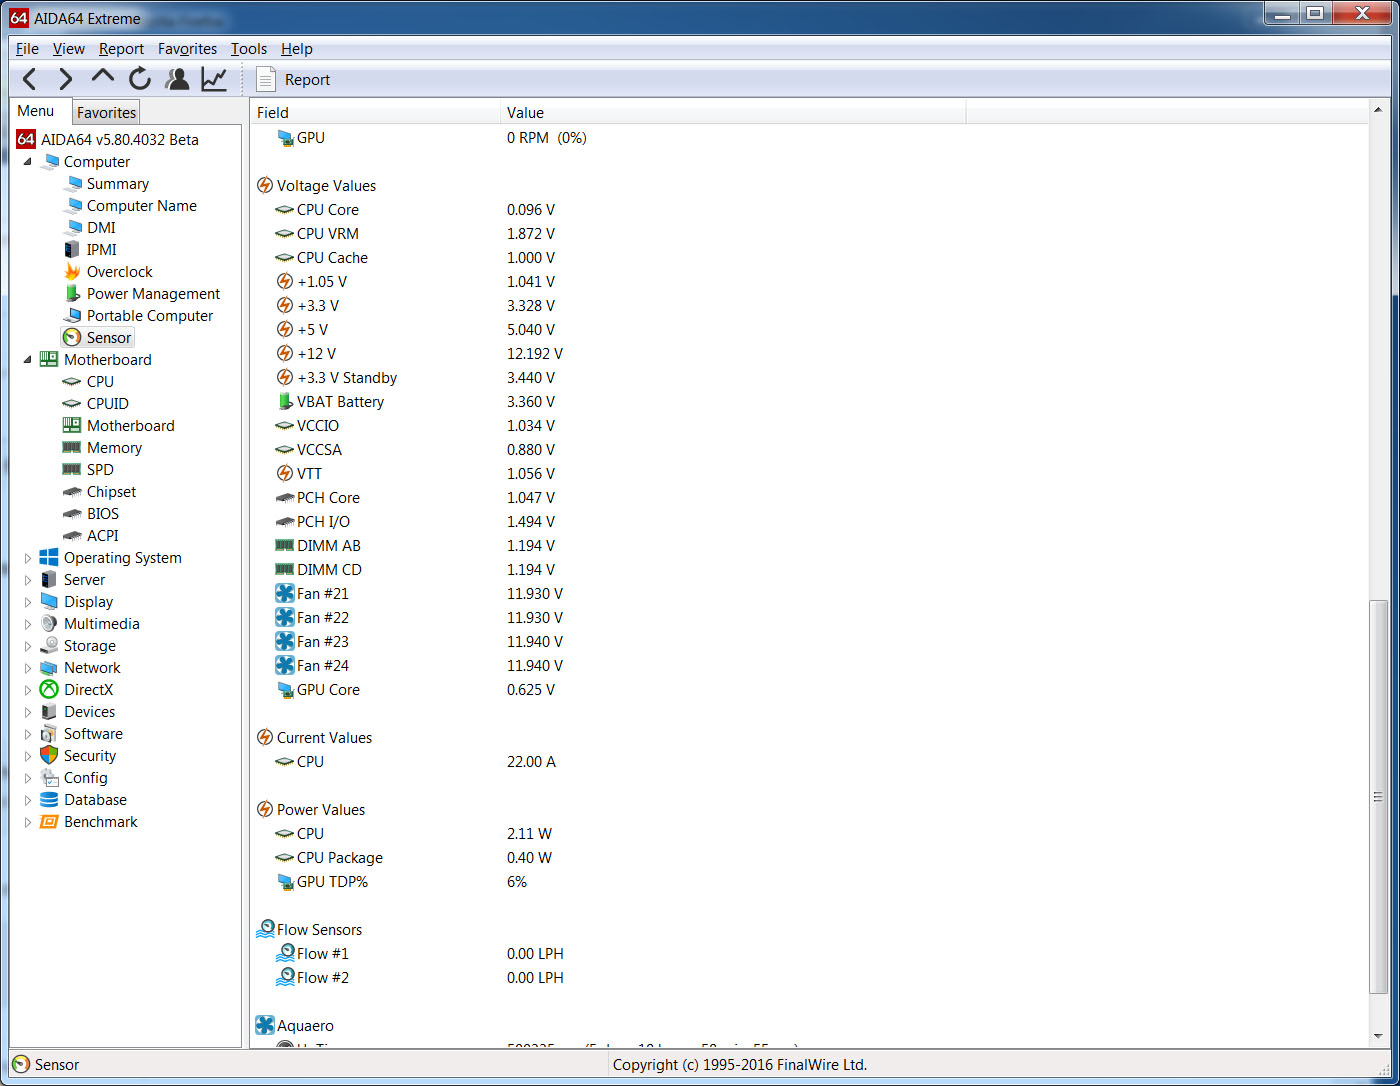
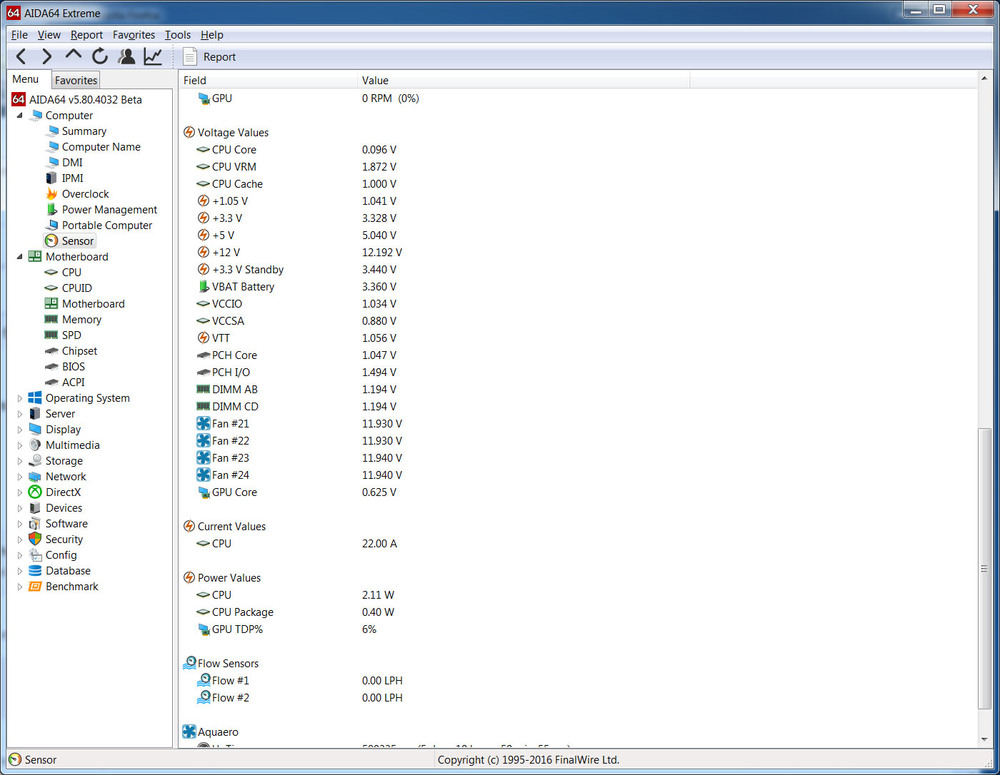
P.S.- I also noticed that under 'Power', the CPU Power value seems low (maybe because of the low voltage ?...). Under heavy load, I saw the AIDA 64 CPU Voltage reported as 0.08V, the current as 52A, and the CPU power as 4.16W. It's true that 52 A x 0.08 V is 4.16W. So, is this a different power than the overall CPU power, or just incorrect? I may be wrong, but I was under the impression that this CPU has an integrated Voltage regulator. In that case, would the actual power be better approximated by using the CPU current and external supplied voltage ( 1.872 V in this case)? That would make the CPU power closer to 1.872 V x 52 A (for example) = 97.34 W. Thanks; -
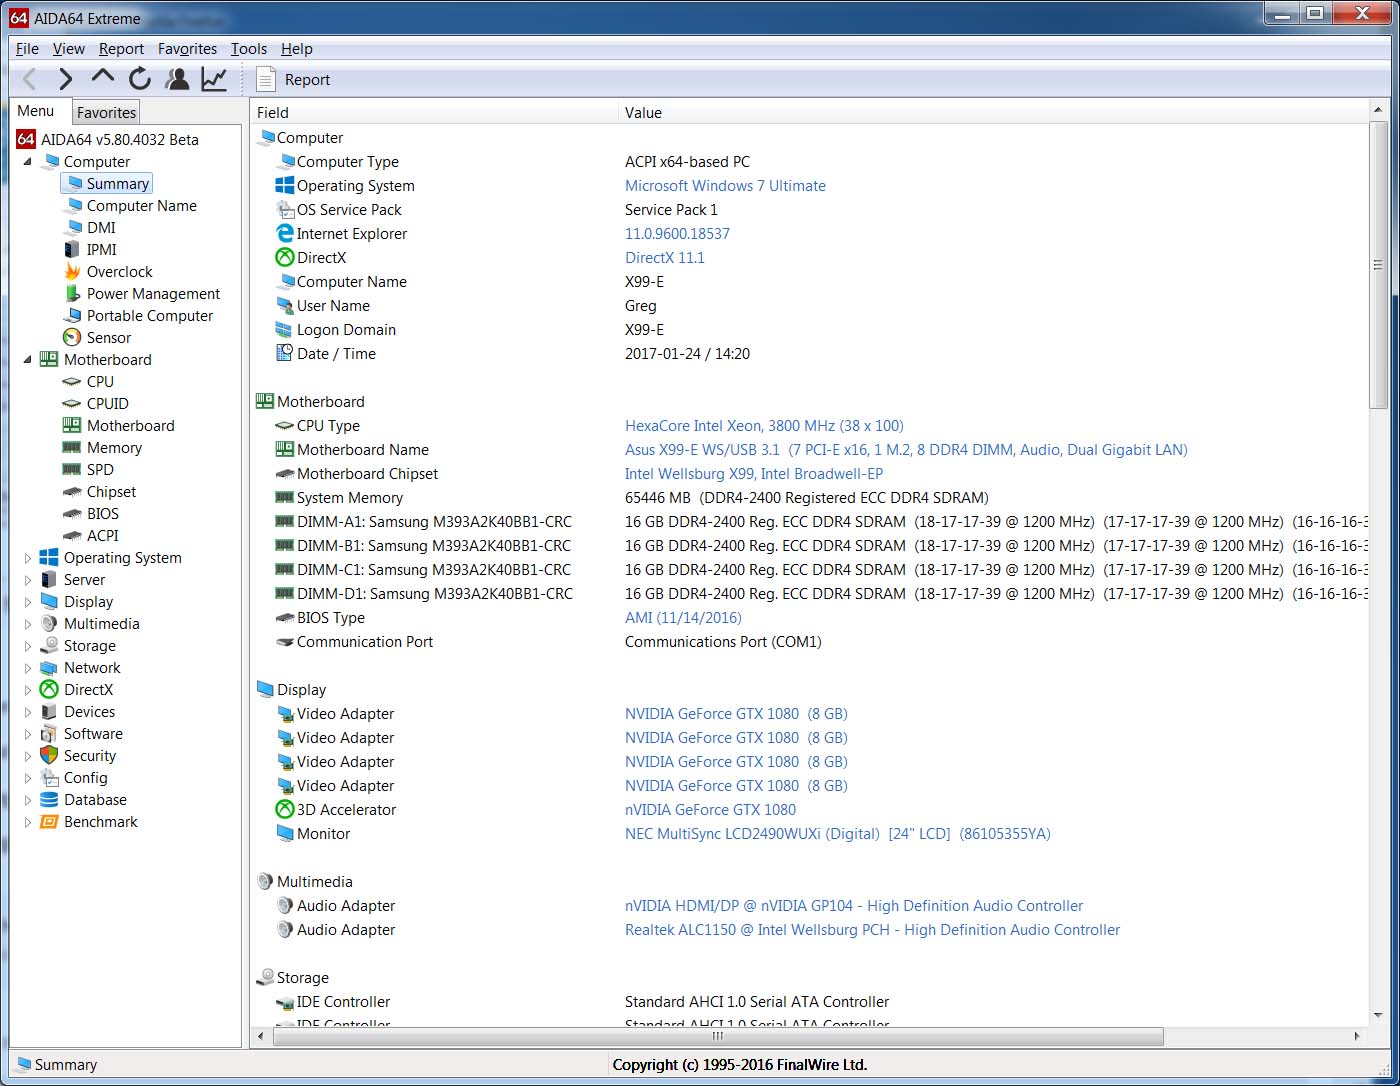
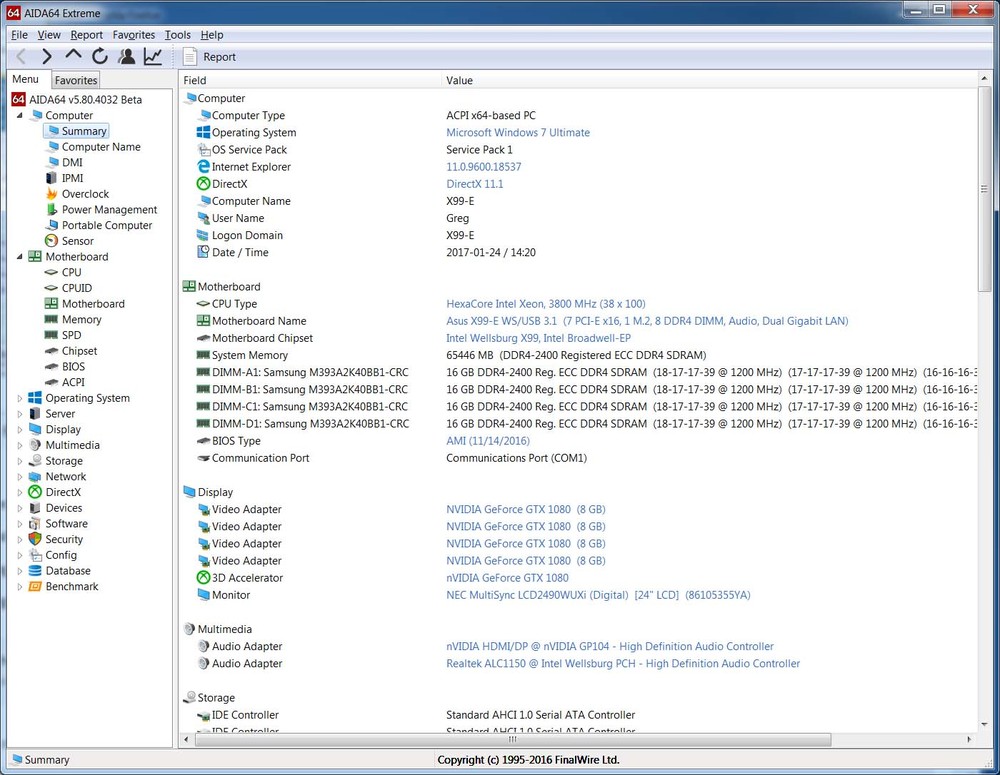
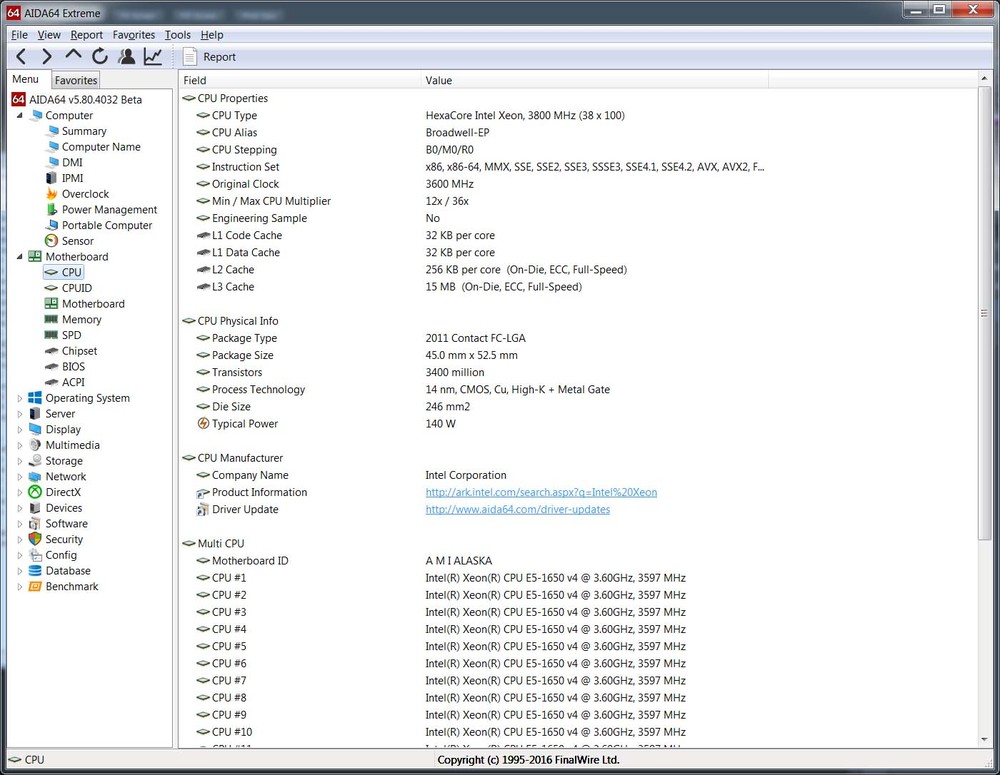
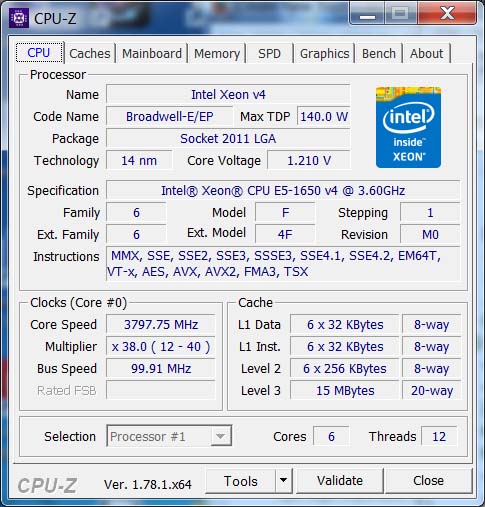
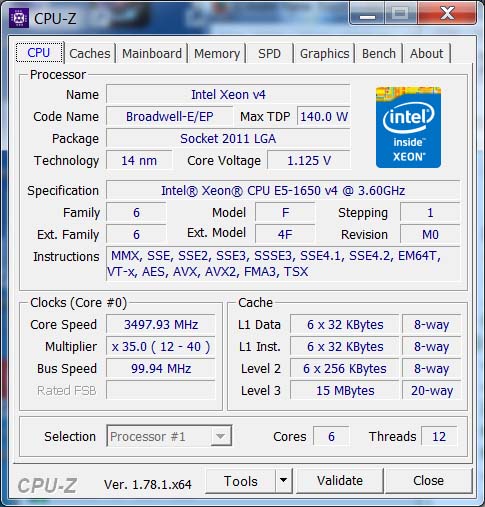
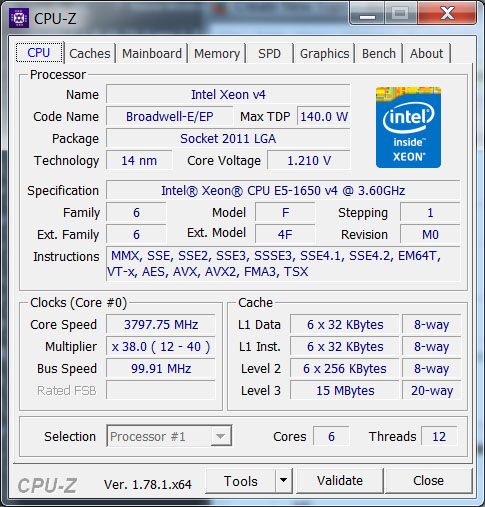
Hi; I'm trying to determine what core speeds I'm getting from my cpu (E5 1650 v4) under Windows 7 64-bit. I'm very confused by the different values I see in different locations (I'm thinking I just don't fully understand what gets reported when/where). My understanding is that this CPU has a base frequency of 3600 MHz, with a Maximum frequency of 4000 MHz (according to the Intel ARK page). Are the AIDA64 Motherboard/CPU and Computer/Summary pages 'static' in the sense of just reporting the CPU type, or dynamic in the sense of showing what the CPU is currently up to? The Motherboard/CPU and 'Computer/summary' reports the CPU as a 'Hexacore Intel Xeon, 3800 MHz (38 x 100)'. If this is just a 'static' informational display, should that really be 4000 Mhz? Or is this what is currently being used? Running under light load, I can see that CPU-Z reports a core frequency of 3796 MHz or so (for at least some part of the CPU). If I start Prime 95, then CPU-Z reports a speed drop to 3500 MHz or so (But I thought the minimum frequency was 3600 Mhz?...). But in AIDA 64 the two above pages report the same values as was shown under light load. Does AIDA64 have the ability to show what frequencies are currently being used? I have the 'Intel Turbo Boost Max technology 3.0' utility installed, in case that makes a difference. Thanks;
-
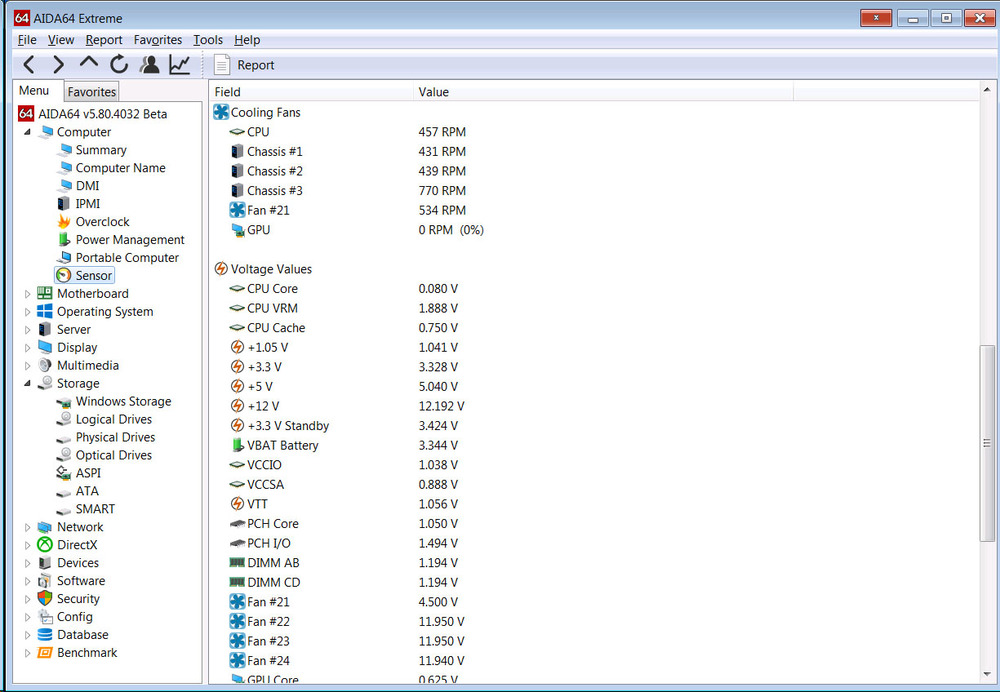
Hi; I'm running an Intel E5 1650 v4 in an Asus X99-E WS/USB 3.1 motherboard under Windows 7 64 bit. I noticed that the AIDA64 display for 'CPU Core' seems surprisingly low at 0.096 V. CPU-Z seems to report 1.21 V at the same time. Are these the same voltages being reported? The version of AIDA64 I'm using is a Beta (5.80.4032) to be able to read my Samsung 950 Pro NVMe temps. Thanks;
-
Memory DIMM info. display error? (Asus X99-E WS/USB 3.1)
gbohn replied to gbohn's topic in Hardware monitoring
Sigh... Something 'squirrely' is going on. I rebooted my system, and noticed that after that, the display had changed to where DIMM B1 was displaying o.k., but DIMM D1 appeared the way DIMM B1 previously had: I killed AIDA64 manually then restarted it. This time only DIMMs A1 and D1 showed up under the summary (so B1 and C1 didn't show up at all in the summary). Killing and restarting it again shows all the DIMMs with labels. So, the results appear variable... Any idea what that means? Could it be an interaction with the Aquasuite software I am also running? This is Windows 7 Ultimate 64-bit by the way. Thanks;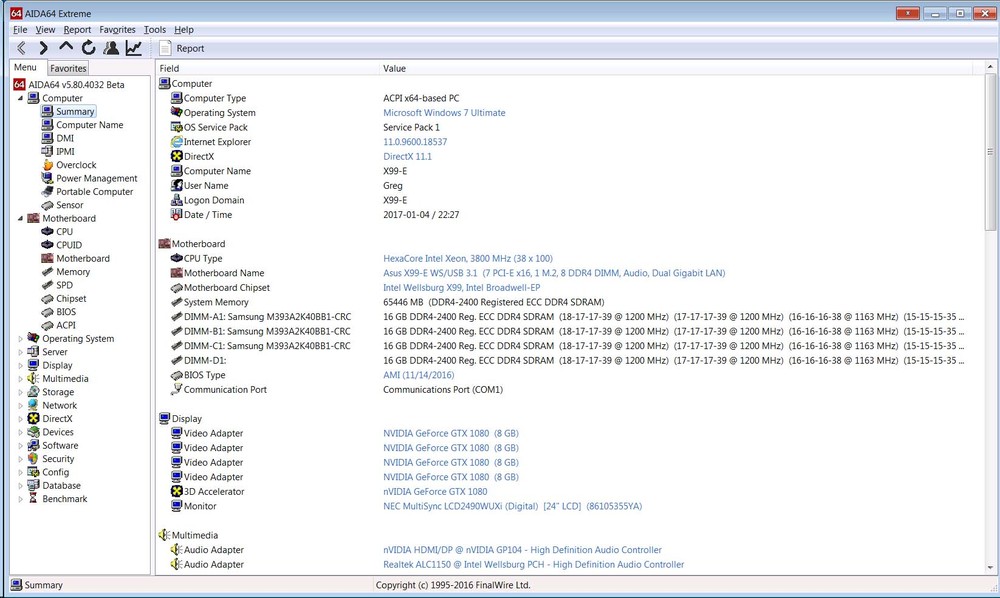
-
Memory DIMM info. display error? (Asus X99-E WS/USB 3.1)
gbohn posted a topic in Hardware monitoring
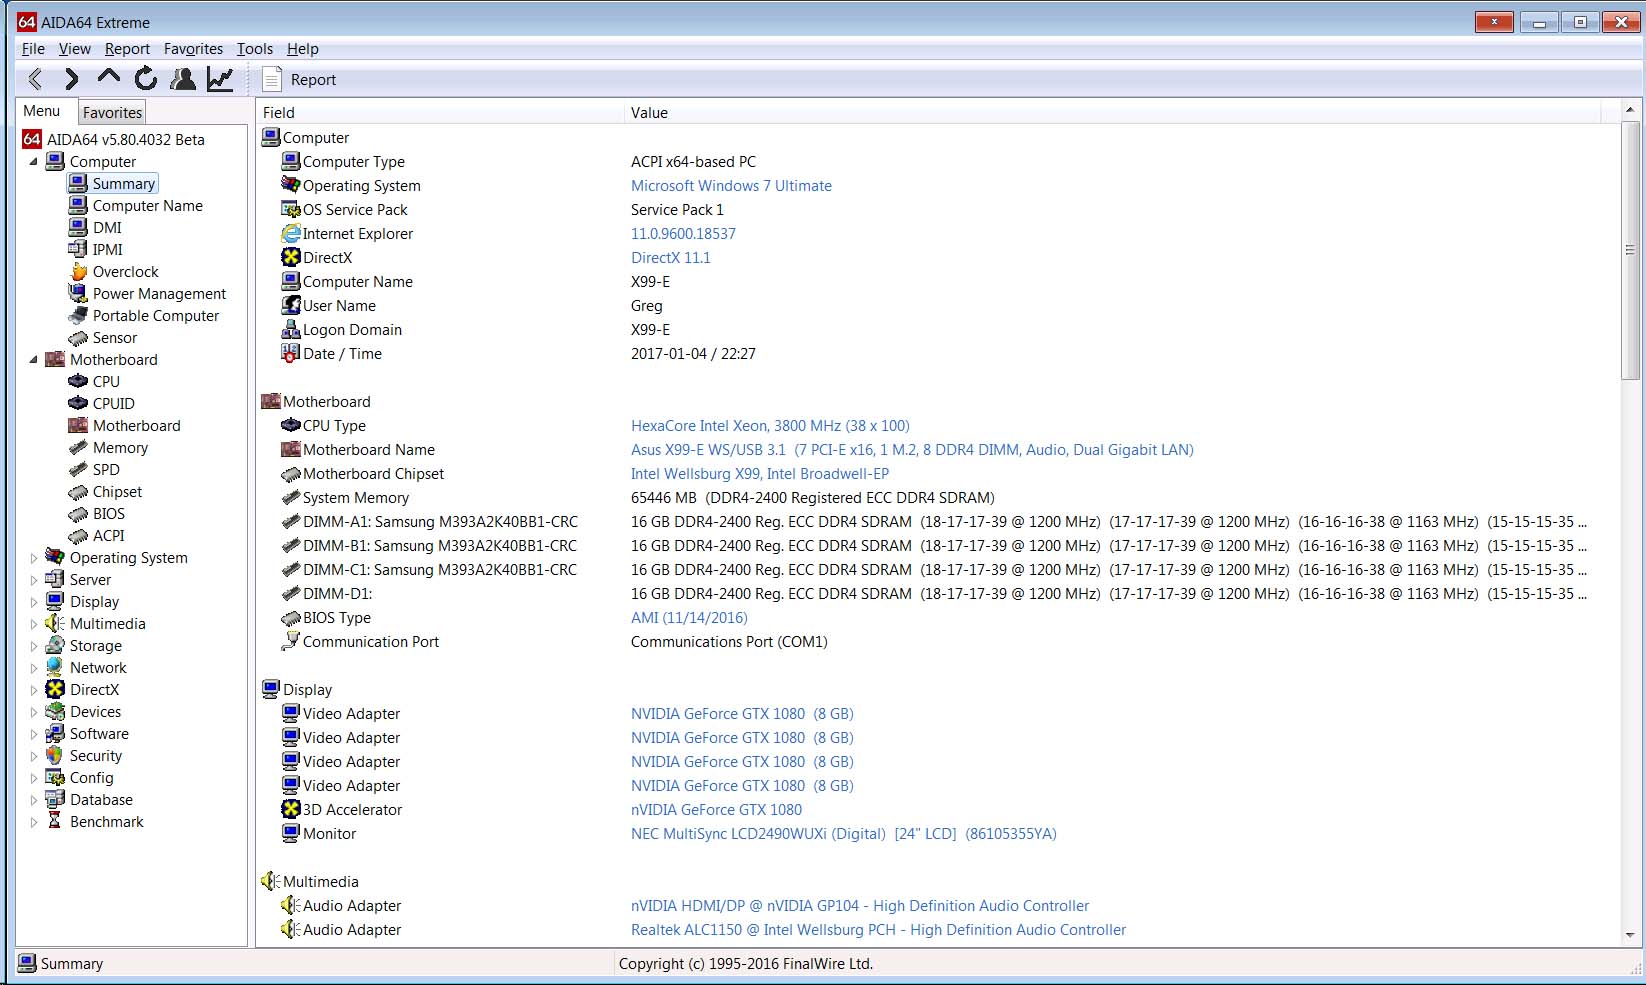
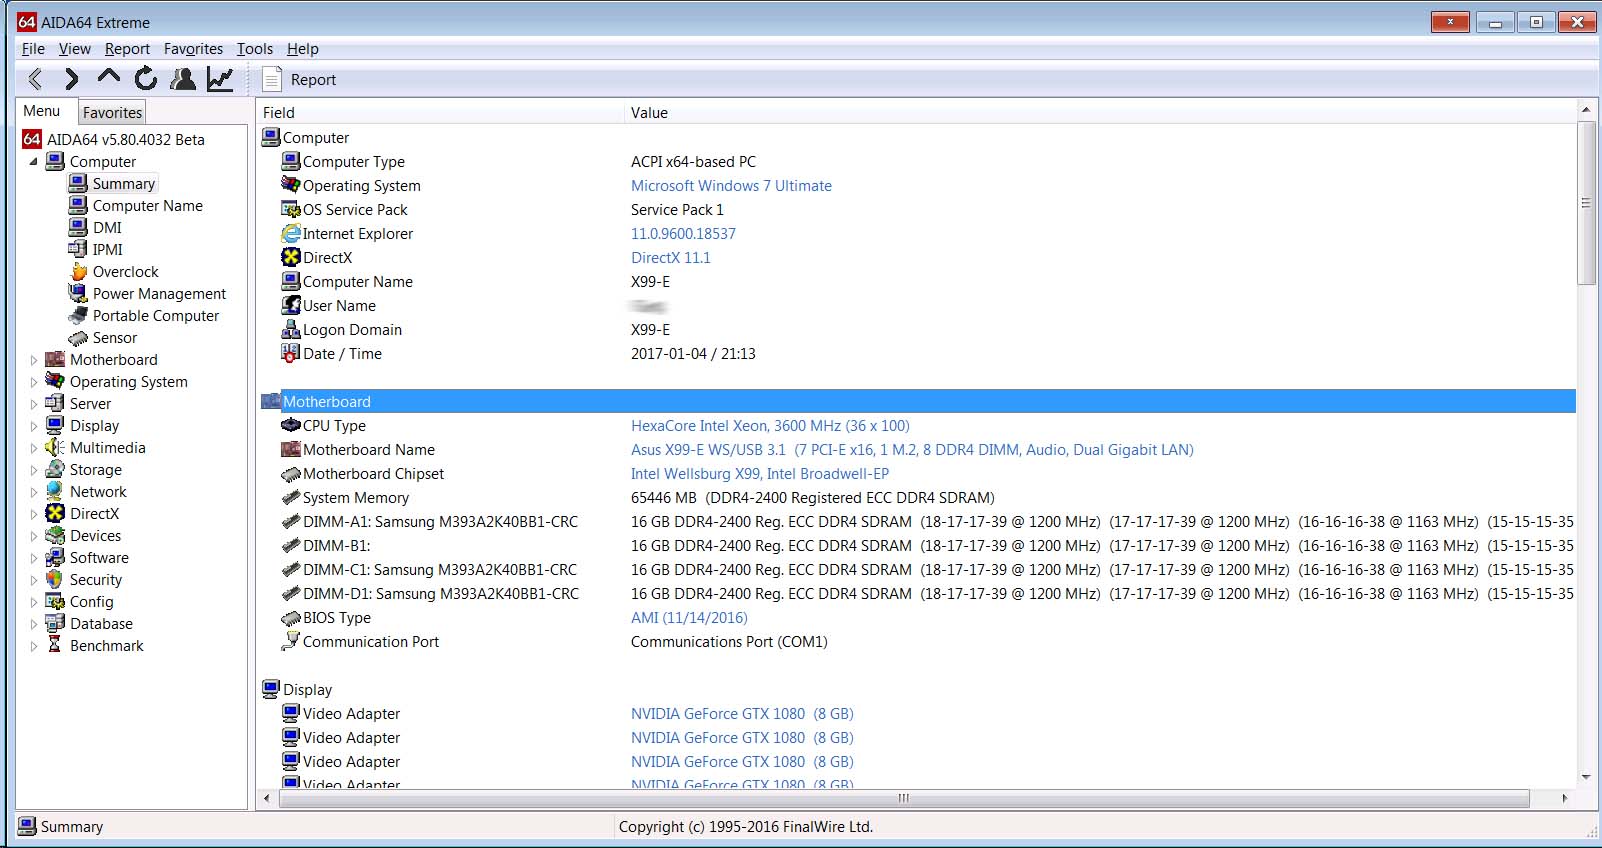
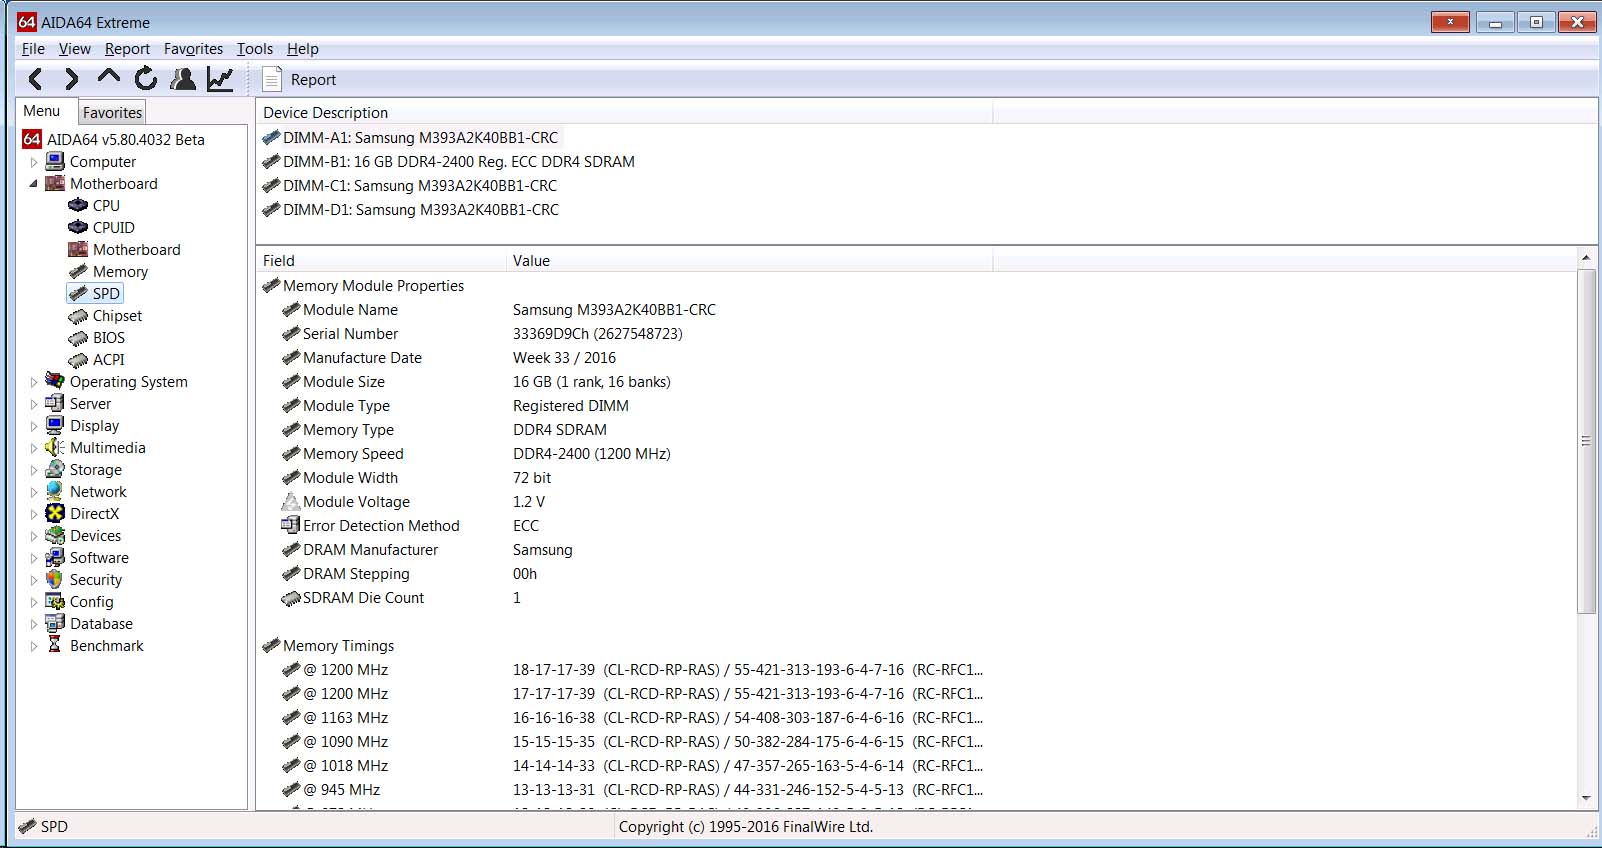
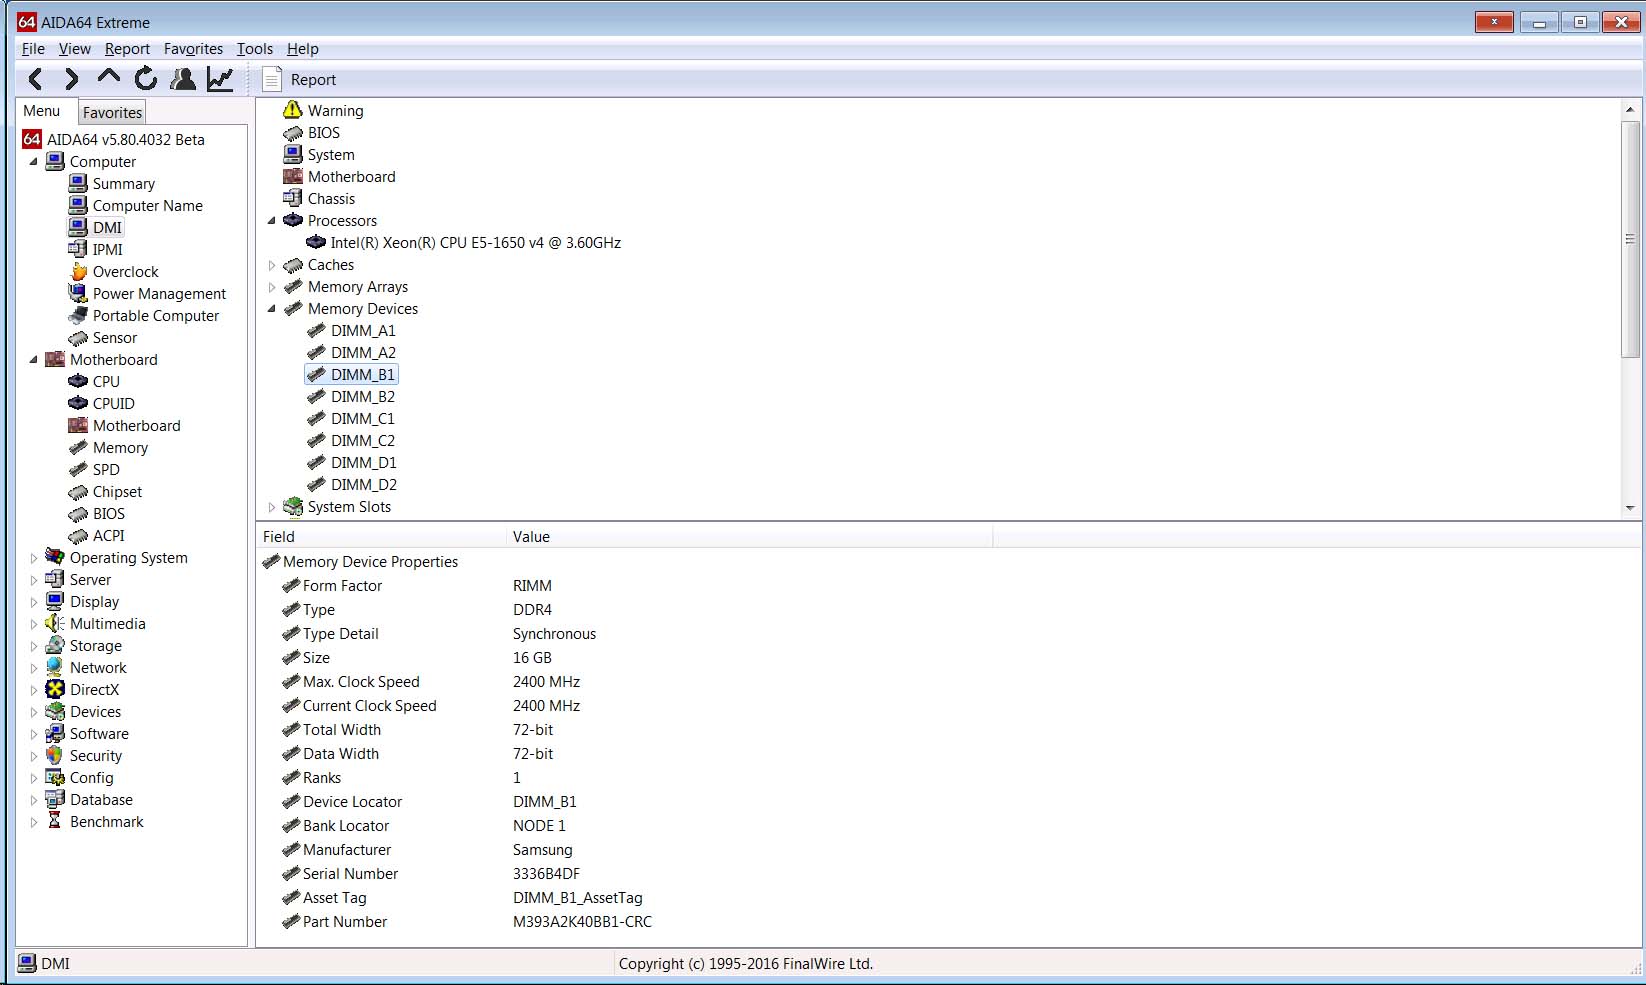
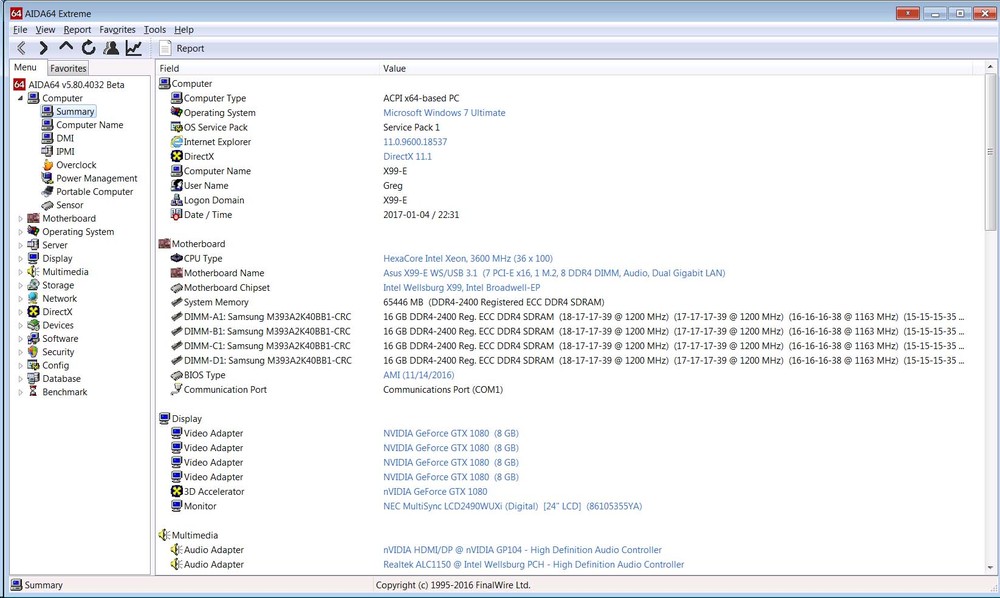
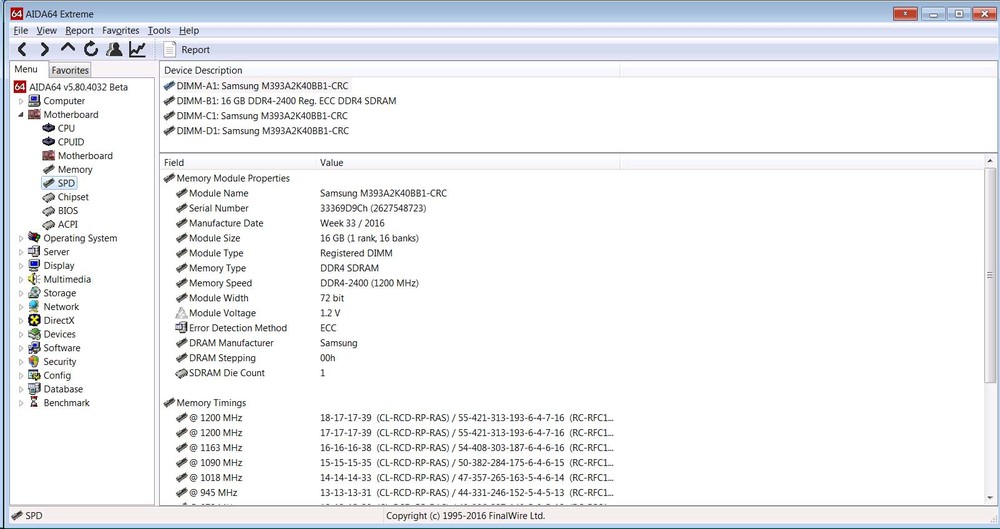
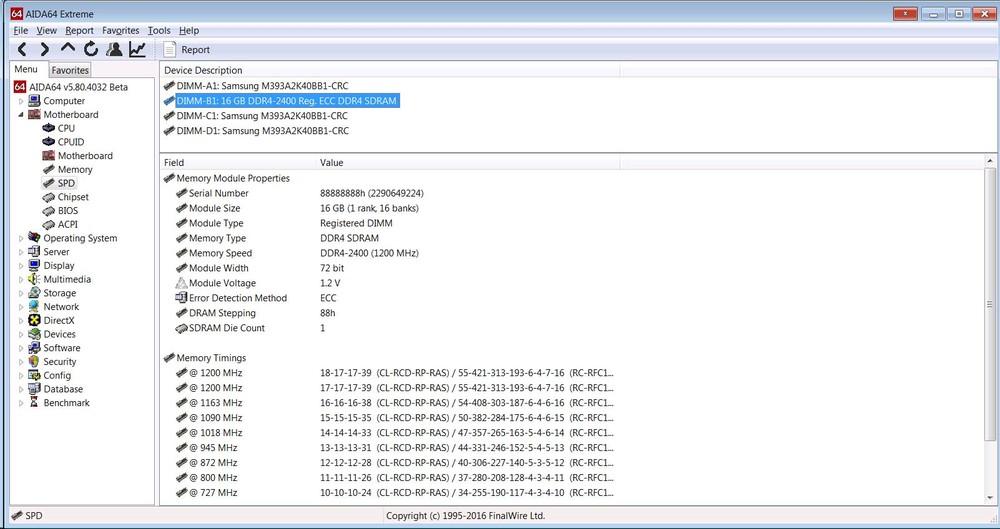
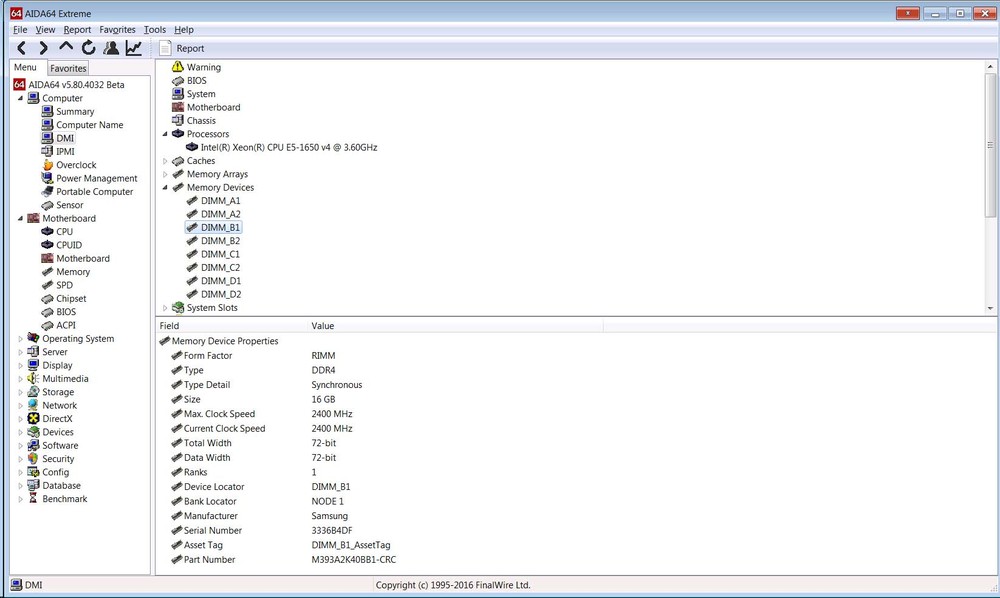
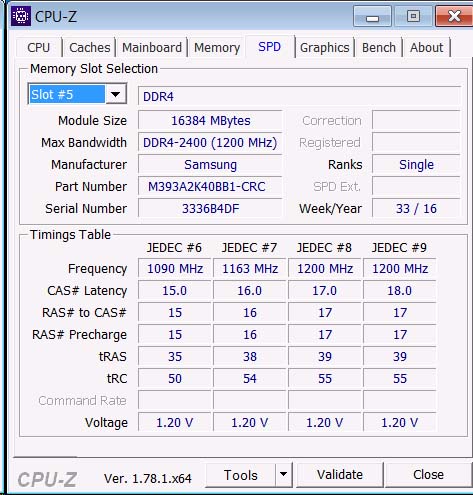
Hi; I have an Asus X99-E WS/USB 3.1 with 64 GB of ECC ram (as 4 x 16 GB Samsung RAM modules). Each of these is supposed to be identical, but I noticed that there are some inconsistencies in the data being displayed in different locations for the one module in slot B1. (This is an 8-slot motherboard with 4 channels x up to 2 DIMMS per channel. I am using one DIMM in each of the 4 channels (I hope :-) ). I'm using the 5.80.4032 Beta at the moment. Under Computer/Summary/Motherboard/Memory I see that the DIMM in slot B1 is listed differently. It doesn't have the title 'Samsung M393A2K40BB1-CRC' the way that the other three slots do. See AIDA-MEM-1.jpg. Motherboard/SPD also lists the module in slot B1 a little differently. See AIDA-MEM-2.jpg and AIDA-MEM-3.jpg. The serial number and DRAM stepping of B1 seems bogus (888888888). The entries under Computer/DMI/Memory Devices/B1 seems to show a more plausible serial number: For what it's worth, CPU-Z 1.78.x64 shows Dimm B1 SPD as the expected value (and all the DIMMS the same except for serial #). Do you think this is just an Aida 64 display quirk? Thanks;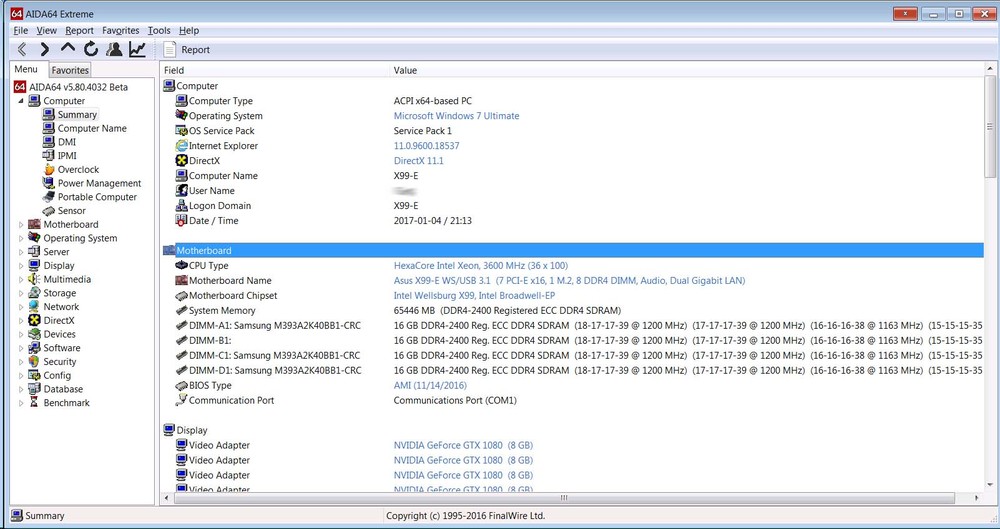
-
> As for the GTX1080 fan issue, please right-click on the bottom status ... I attached the data you requested (I got the card heated up a bit by running the GPU benchmark until the fan started). Maybe I'm misunderstanding, but I didn't think I really had a fan issue with the graphics card. I think the fan doesn't start moving on this card (if it's in 2D/desktop mode at least) until the GPU temp. reaches 60 C. So, at idle I was expecting it to read 0. And it did display a speed once the temp. got above 60. Thanks; nvidiagpureg.txt
-
> After upgrading to this new version, make sure to restart Windows to finalize the upgrade. > Let me know if it helps about the missing fan. I tried the 5.80.4032 Beta version, and the chassis #3 fan still didn't show up (when not turning). But, I changed the BIOS Fan control settings so that it is always rotating, and now it shows up. It appears that it is only displayed when it it is rotating. I don't know if that means it will cause problems for the log as it starts and stops. In my case, since I know there is a Fan #3 that may or may not be turning, it would be nice if there was some way to tell the logging that I would like it be displayed even when stopped. Unlike Chassis fan #4 which I know currently doesn't have anything connected. Is there any way for you to tell if a fan is actually connected, even when stopped? Does a PWM fan work any better in that regard?
-
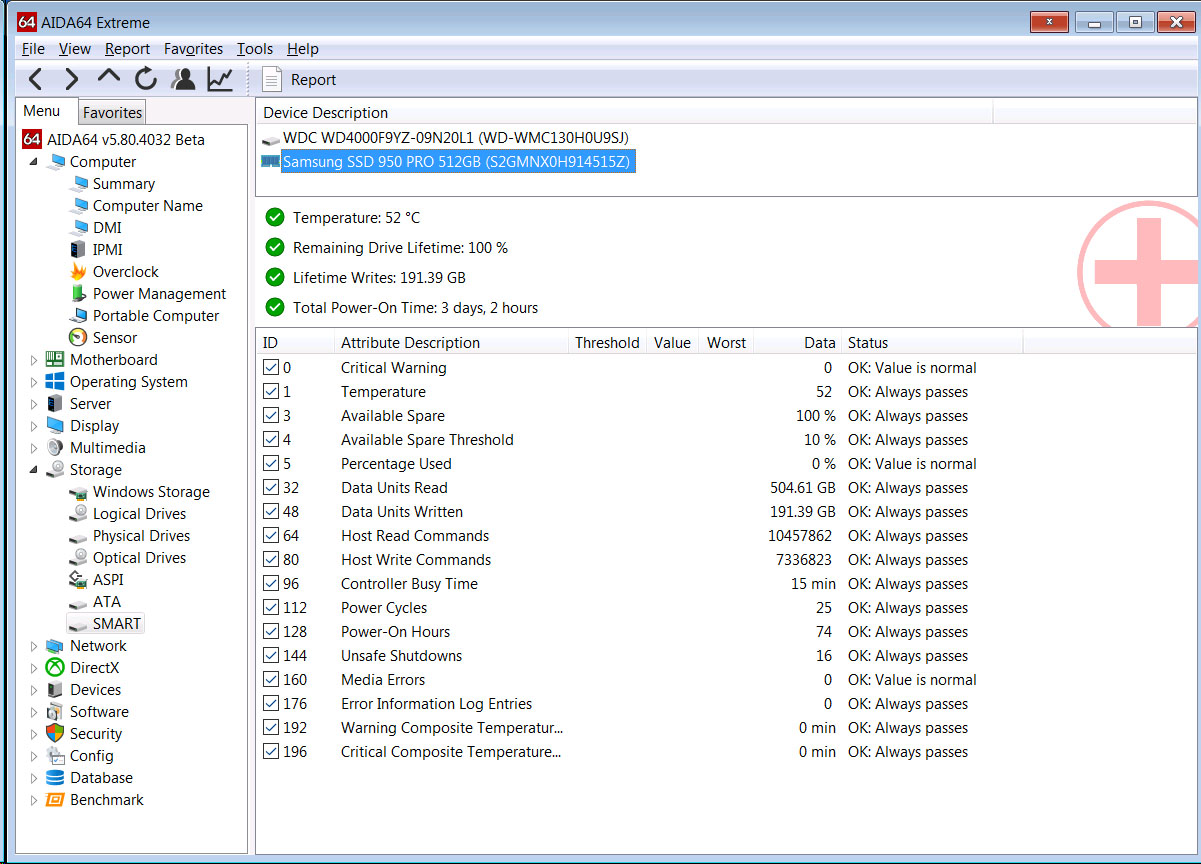
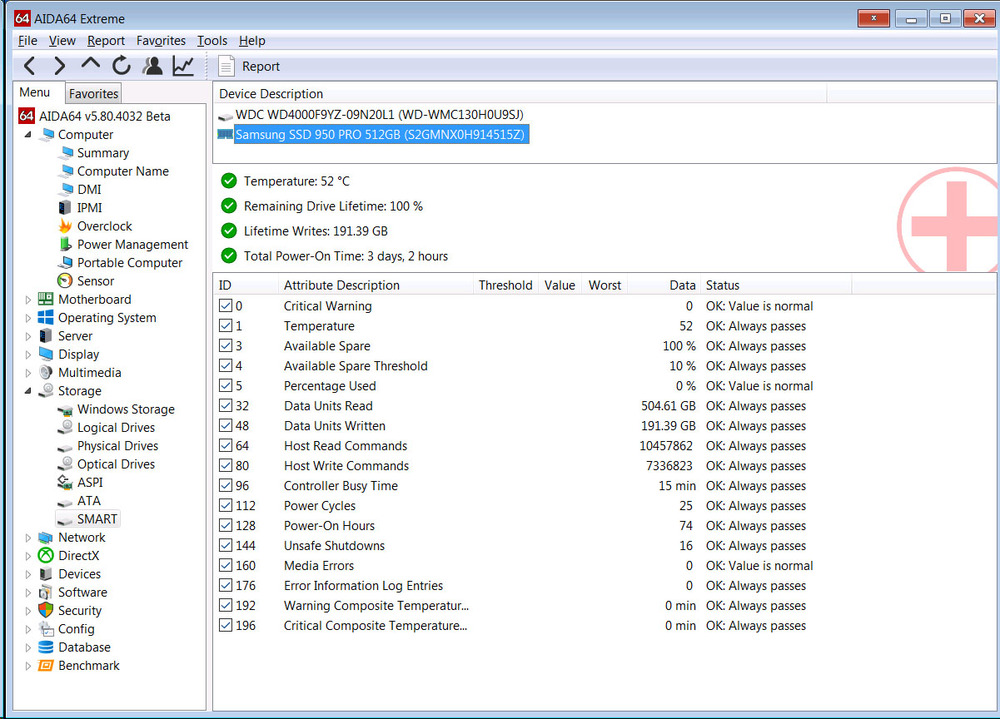
Hi; I installed the beta version 5.80.4032, and I now see an entry for the Pro 950. Thanks. It doesn't seem to have any of the Threshold/Value/Worst scaled entries. Do those values still apply to NVMe drives? But this is much better than before. Thanks;
-
Thanks, I'll try the latest beta. To answer your question In the meantime, I have a new MSI GTX 1080 Gaming X video card. The whole system is new, and as far as I remember I think the fan doesn't start until it gets above something like 60 degrees C (or some warm temperature). So, showing up at 0 RPM seems correct as far as what I was under the impression should happen (for that card and those conditions at that time). I did see it report a speed (about 1100 RPM) under load in a quick test I did).
-
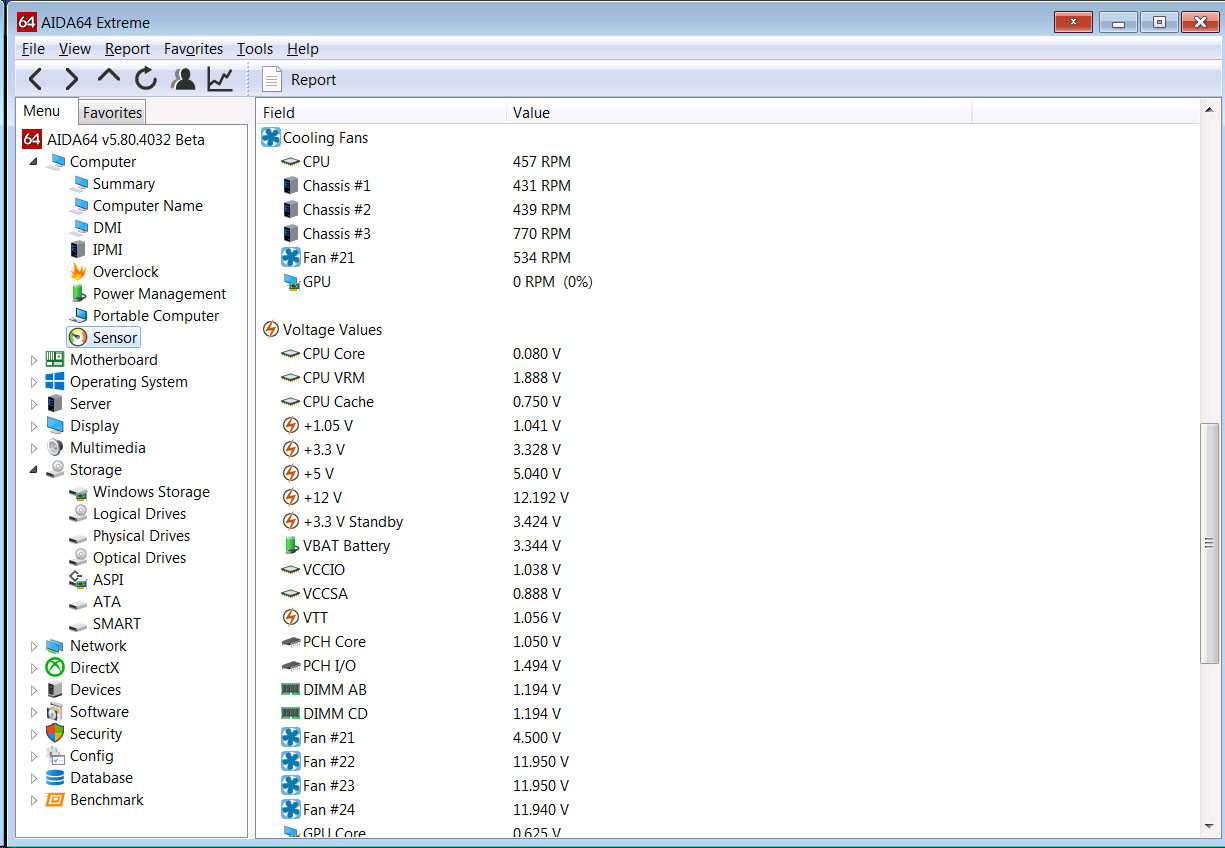
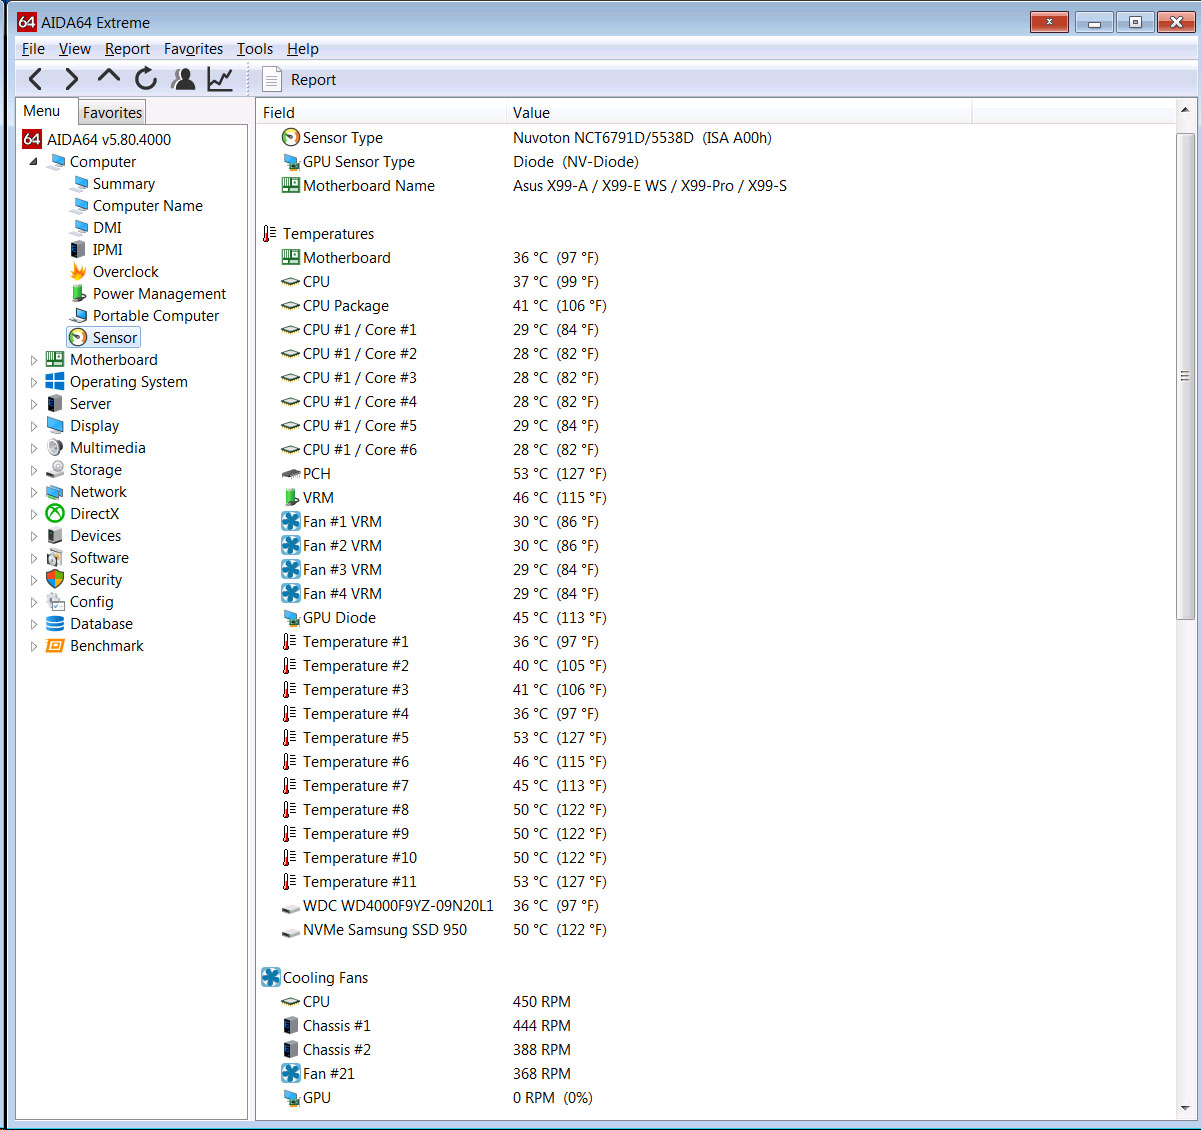
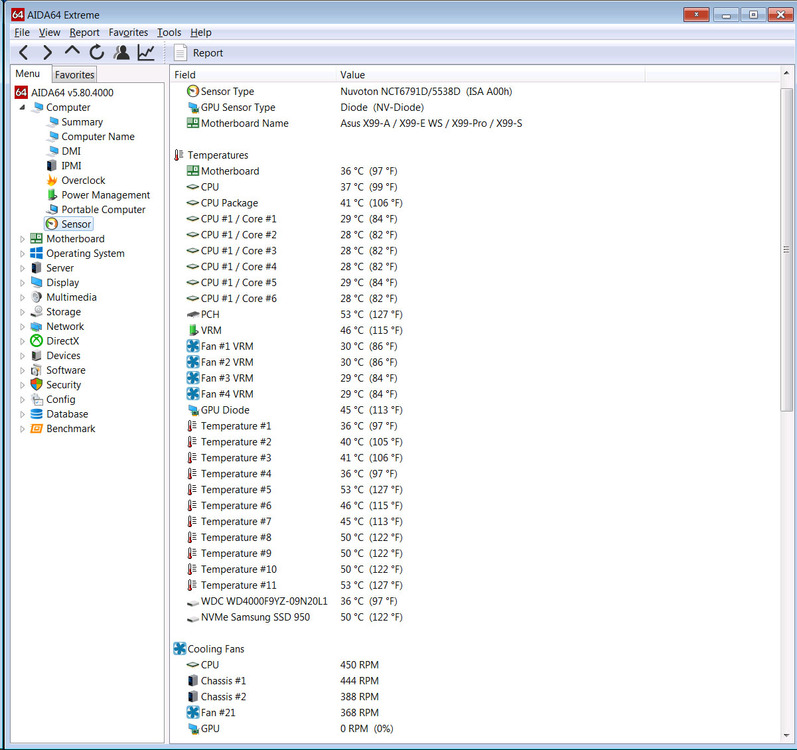
Hi; Running AIDA64 5.80.4000 under Win 7 64 Pro on my Asus X99-E WS/USB 3.1, I noticed two sensor values seem to be missing. 1) I have installed the single optional external 'Thermal sensor', but I didn't immediately see an entry for it. (See No-Tsensor.jpg). 2) It also appears that there are no entries for at least one of the motherboard controlled fans. The motherboard has CPU_FAN, CPU_OPT, and CHA_FAN1 through CHA_FAN4. I have fans connected to CPU_FAN (PWM), CHA_FAN1 (PWM), CHA_FAN2 (PWM), and CHA_FAN3 (DC). I don't seem to see an entry for the CHA_FAN3, although it isn't currently rotating because the set temperature is below the threshold. Do these entries only show up for fans that are rotating? I notice that the GPU entry does show up when it's not rotating... Since these are 120 mm and 140 mm fans, I usually don't need them rotating very fast. 3) I think that 'Fan #21' is the Aquaero 6 Pro connected fan (Having AIDA64 import this is really helpful for recording!). I also suspect that 'Temperature #2' is the Aquaero 6 Pro attached thermal sensor (using Aquasuite 2017-1.3). It's a bit tricky trying to determine what the generic 'temperature #x' values are from. Thanks;
-
Hi; I just build a new system on an Asus X99-E WS/USB 3.1 motherboard. I have a Samsung 950 Pro M.2 drive mounted on the motherboard's M.2 socket. I'm using AIDA64 Extreme 5.80.4000. I don't see the 950 Pro listed under the Storage/SMART section, despite seeing an entry for it in Storage/Physical drives. I noticed that under 'sensors', I do see an entry for the temp. of an 'NVMe Samsung 950 Pro' as well. The 'Samsung Magician' software does show 'Smart entries' for this drive. Is there any chance for AIDA64 to display S.M.A.R.T. values for this drive? This is under Windows 7 64 Pro. I tried the Samsung 2.4.7 NVMe drivers as well as the newer 2.0 drivers with the same effect. Thanks; P.S.: This is booted in Legacy/CSM mode, not UEFI in case that makes a difference.
-
As a follow-up, things have continued to work better. So whatever the issue was initially, it seems to all be working as expected now. The account I log in as has Administrator status, but sometimes I've seen that programs still do something extra that triggers a UAC prompt. In my case, I was letting Aida64 get auto-launched (and it wasn't asking for elevated permissions). Just to see if it made a difference, I explicitly manually launched it with 'Run as Administrator'. This seems to have sorted things out, but I guess that could have been coincidental with Windows itself sorting something out. At any rate, letting it auto-launch (without anything special) at log-in seems to be working for me now and I'm seeing all the sensors (knock on wood...). I'm currently running the 4.00.2752 Beta.
-
So, if that's the case, is there a way to have Aida64 run as Administrator when 'Load at Windows startup' is selected? I'm using the load at startup feature because I have an Aquero 5 and its software (also started on login) is reading some sensor values from Aida64 (I can't remember if this is through WMI or 'Shared memory'). For what it's worth, I have rebooted my system, so Aida64 started automatically when I logged on and I'm currently seeing all the sensor values. I'll have to see if it stays that way.
-
I'm running the 332.21 WHQL drivers. Originally I noticed that re-installing AIDA64 seemed to bring the values back, but then they would dissapear for some reason after a while. I was beginning to suspect that maybe this had to do with the system being hot or cold, but now I'm not so sure. I have AIDA64 set to 'Load AIDA64 at WIndows startup'. Yesterday I manually exited Aida64, and launched it explicitly as Administrator to see if that helped. It seemed to, as the values came back. At the moment, they are still showing up. So, I guess I'll have to run it some more and see if this permanantly fixed the problem or not. I'll update and let you know. Thanks;
-
Hi; I just upgraded my graphics card from an Asus GTX 670 OC (Direct CU II) to an Asus GTX 780 OC Direct CU II (GTX780-DC2OC-3GD5). This is under Windows 7 64-Bit. When I first brought up Aida64, I saw sensor entries for various GPU items. After a reboot, some of these entries seem to have disappeared and are no longer seen or logged. (I still see the other entries for GPU MHZ, GPU fan speed, etc. though). Specifically, the sensor values for these entries no longer appear anywhere I can see: GPU VRM (Watts) GPU VRM (Amps) GPU +12V (Volts) GPU VRM V (Volts) GPU VRM (Degrees C) When they were recorded, they seemed to have had plausible values. I was running Aida64 Extreme 4.00.2700 when I first saw this. I updated to Beta 4.00.2746 to see if this would help. The missing values came back, but are gone again after the next reboot. So, is there any way to get these entries to come back and stay? Or should they never have shown up in the first place? This is on an Asus Rampage Formula III motherboard. The entries don't seem to show up under Computer/Sensor or in the log. I am attaching a summary with and without these values shown. Thanks; R3F_2014-01-18_23-47-58_stat.htm R3F_2014-01-19_11-41-56_stat.htm