aruff
-
Posts
26 -
Joined
-
Last visited
Content Type
Profiles
Forums
Events
Everything posted by aruff
-
I try
-
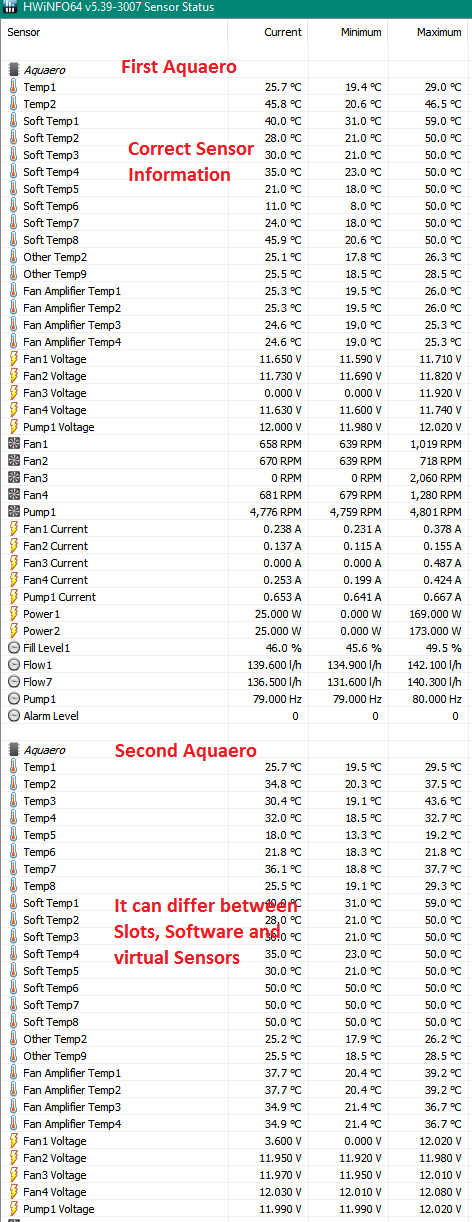
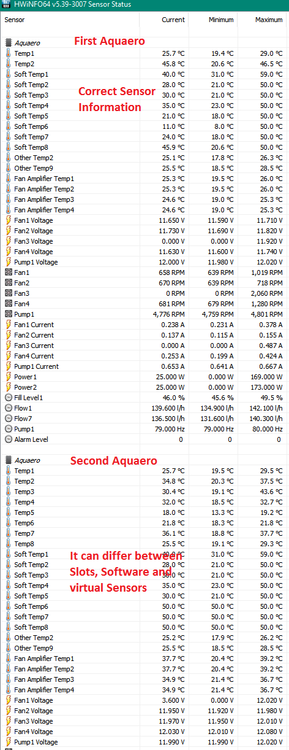
Understand. But, what you say cannot be correct. Let me begin from the first step. 1. AIDA can’t display the Sensor page in a right manner. It shows every second the entry information instead of the wide list. If I scroll down, AIDA pushes back to the head of sensor page. This prevent also to take screenshots from this page. Your answer is, “it is a reappearing device” what cause this bug. And, indeed, it is the second Aquaero what cause this bug. If I disable this device AIDA can show the Sensor page as expected. You must fix this. If you can’t, because program internal limitations, there is a Warning Box appropriate. “AIDA has discovered too much complex device. AIDA is limited and can’t display so many devices” And please, put it also in the documentation and on the Website. I think that is a behaviour what customers need to know “before” they bought this Software. 2.Ok, if there is a limitation in the count of Temperature Sensor you have also describe this in the documentation and, of course, also to your Website. And again, also in this matter, a Warning Box is appropriate. “ AIDA has discovered to many Temperature Sensors, AIDA can’t handle so many Sensors” 3. How did you interpret the complete struggled information of Temperature Sensors AIDA shows? One Aquaero can distribute 18 temperature information, including software temperatures. And, above 4 Temperatures of the Fan amplifiers. If I have one Aquaero connected AIDA shows me “29” Slots and above 4 “VRM” Temps (I think these are the Amplifier Temps). Where did the 29 slots come from? If I put the second Aquaero to the system the slots are expanded to 30. No warning, no explanation. I think the 4 amplifier temps from the second device are completely ignored? Or did the listed values change to the new Aquaero, or is it mixed? So, this is complete cut loose. It has nothing to do with the count of “slots”. 4. You wrote that AIDA can (really) Manage two devices. Excuse “AIDA cannot!” First look again at point 1! Second, look at the picture, there is “one” Aquaero listed, not the second one. Where is the second one if AIDA can handle the device? 5. You wrote that AIDA do not going by “with a per device management” This is also wrong or your explanation is bad. Look again to the picture. AIDA listed there the Aquaero and, in context, some information from this device. Also, the Aquastream is listed as device. (so you can’t obviously not discover the second device). MPS is the next “per device”. Apparently, the software can do a “per device” Management. So, what we are talking about? Is it your strategy to list all temperatures devices in one block? Fine, then expand the count of Slots in the block so that it can handle more then 30 slots. If you do so, wrote in front of the value the device it comes from. Call it a prefix. So, the user can discover where the value is read. No further need for an "per device management" But you have to discover all availible devices and if you cant handle so many devices display a warning message. And, please, document these limitations AIDA has.
-
Ah, and of Course, Temp 1 on Aquaero 1 is the "Slot one" on this Board. No search, no "maybe"
-
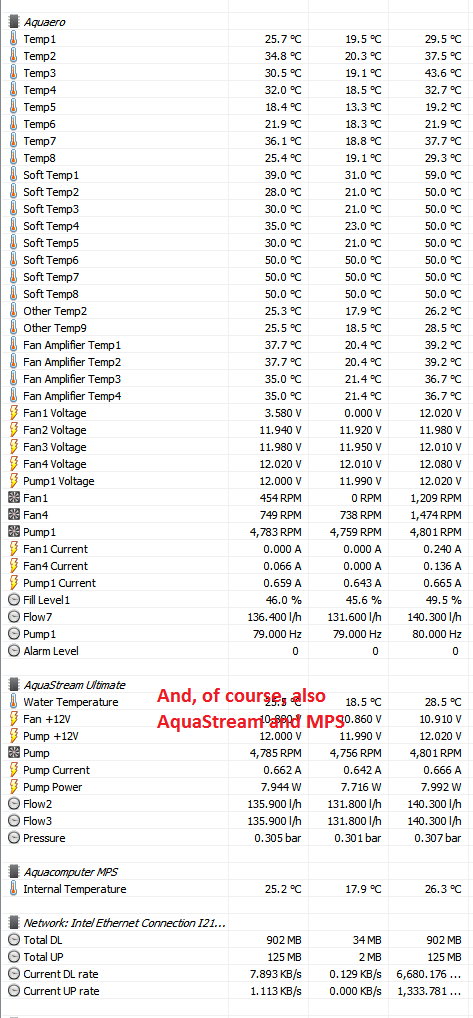
Hi, did you try anything on this issue? HWINFO can do it flawless. HWINFO can differ all devices, all specifics from Aquacomputer like Software sensors, virtual sensors. All Fan Information, Amplifier, it can differ between Aquaero and Aquuastream. This is overall “perfect”. Why can AIDA do not? And, please, don’t answer “Use HWINFO instead” Attached, some Screenshots
-
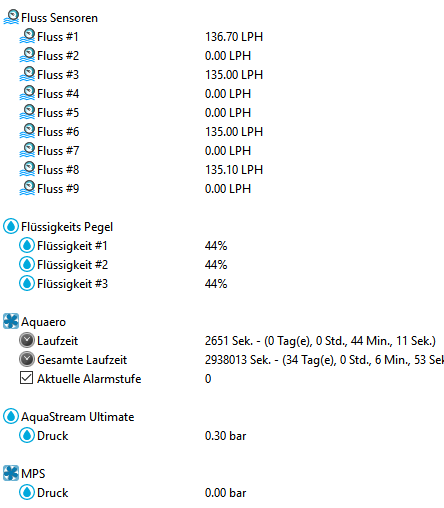
I have done some investigations and it seems to be the second Aquaero what cause the reappearing effect. If I complete disable the 5LT, disconnect it also from Aqua-Bus, the effect does not occur. In the list itself it is only a flicker seen, no other feedback. No additional Info’s or List items. How wonder, you display “Aquaero” in the sensor list. But it is always only one. It seems to be that AIDA cannot differ 2 or more devices. Does it have the same name on the USB request? And more, when AIDA displays only the Aquastream and the Aquaero 6 there are 29 Temperature slots. If the additional 5LT is on, there are 30 slots. So I think it collides on many level. Funny, the fill level is displayed correct. This value is distributed on the Aqua-Bus and therefore 3 Times in the sensor list (2 times if the 5LT is out). 1 from the Stream, one from the 6 (here it is connected) and, if the 5LT is enabled, one from the 5 LT. After this, I am not sure that the displayed Information inside AIDA is correct in anyway. The Aquastream is also something like a Aquaero, and this is a popular configuration (one stream, one Aquaero). And the given information is correct? Why does the stream then have not an own List Item? If you look at this, please enable a device description before the Sensor to make it unique. Something like “6pro_Temperature_1” and “Stream_Temperature_5” and so on. This would help so much. I try to become more information from Aquacomputer how it is possible to differ the Information from the devices and from the Bus. If you need it, I have sampled debug Information with and without the third device, included respectively a Aquaero (sensor) dump. I can’t do it without the Stream or the Aquaero 6 because this may be influence the system to much, even when it is idle.
-
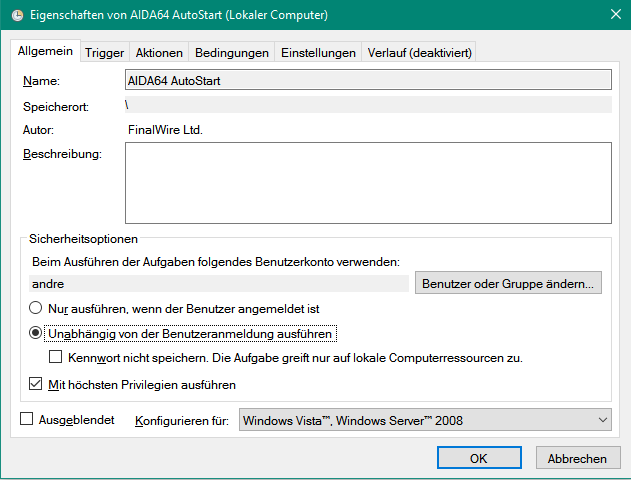
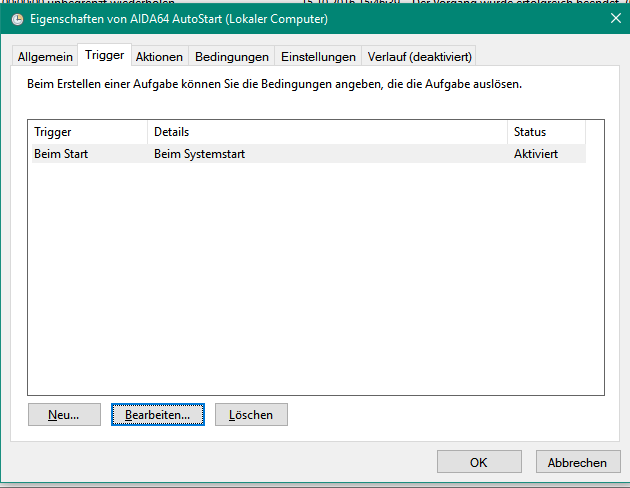
Hello, this works. I can start AIDA in that way and, therefore, it is independent from User Login. Fine. If I start AIDA in that way the Information in System tray (if I want to show) is missing. Understand, system tray is not available during the system start up, it is available after User login. But, and this is something wondering, after I have chosen that start option I can’t see any possibility to configure the running AIDA session. If I start AIDA with the Icon this will not bind the GUI to the running session, it seems to be that AIDA creates an additional session. So, how can I configure the running session without using a new instance? Or, in other words, how can I start the GUI on the running session?
-
Ok, understand. But this is not visible to me. Where can I see what sensor is reappearring?
-
Thx
-
I try to start AIDA within system start and not after Login. I use a different schedule configuration, see pictures. Of course with the right privileges. This does not go. It seems that aida sets back this configuration always to “Within Loggin”. Why is it so? Can I configure AIDA start up in that way, that it is activated without user login?
-
Hello, when I display the „Sensor“ side inside Aida and I scroll down to display the bottom information AIDA refresh the side every 1 second and show the side always from the first entry. It is not possible to monitor some “down” information for a longer time, nor is it possible to make screenshots in the normal manner. Maybe this is a result because I have more sensors then on one side fits?
-
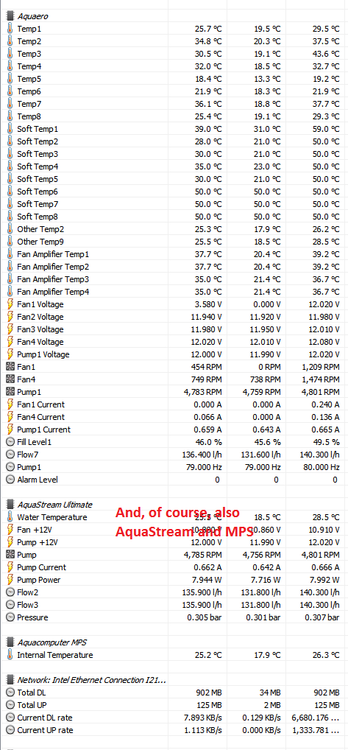
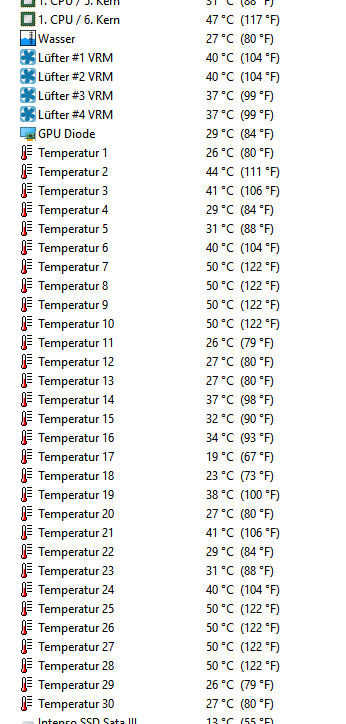
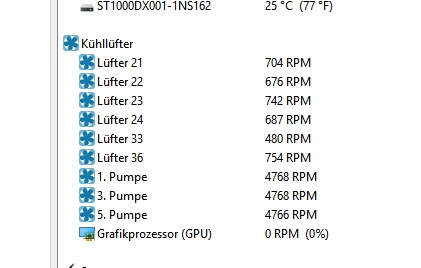
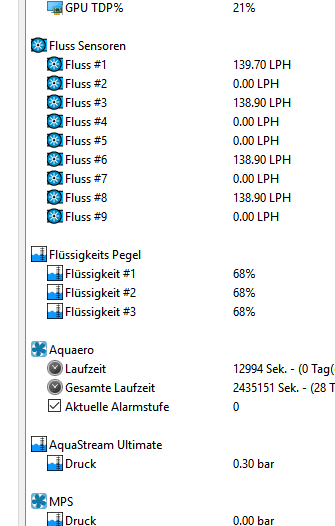
Hello, I use a aquaero 5 LT and an aquaero 6 pro and an aquastream ultimate pump with controller in the same system. I like to display some information on an external LCD. When I look to the Sensor Page in AIDA it displays me obvious many information from the aquaero’s as expected. It shows me 30 additional Temperature information (pic) and an “water” Temperatur and 4 “VRM” Temperatures. See Picture. 1. The two aquaero delivers each 8 temperature sensors. What are the 14 in addition? 2. How can I identify those temperature sensors? Temperature 1 to 30 is not a good information. 3. On what aquero does they reside, on what connector on the auqaero? Can I determine this? 4. What are those sensors that have a 50° value? I think they are the sensors that where not connected. I#m right? And why then 50° 5. What is the “Water” Temperature? Is it the ultimate sensor? If so, why can you determine this and not the other sensors? 6. The VRM temperatures are the aquerao 6 pro fan electronic modules temperature? Why can you determine this? 7. The auqaero 5 does not produce this information? 8. By displaying the flow rate there are 9 sensors available, why? 9. Three of the flow rate sensors displays the virtual flow rate from the pump (not measured), and the other one is the flow rate of the additional physical sensor. Why is the pump displayed three times? 10. By looking on the fill level sensors, there are 3 sensors available, all three sensors display the same value. Why? 11. By displaying the rotational speed, here the pump rotation, there are three pumps available. Same rotational speed because I have only one physical pump in my system. I would give me a great pleasure to become explanation for these points. Some of the quastions I have asked also Aquacomputer for explanation. The short answer is, this you must ask AIDA, they read this information via USB out of our equipment. The naming, sorting or whatever is the matter of AIDA.
-
Avowed! Now I can give you the idea. Look at the Video attached as link. It is a question of the Windows energy saving parameters. In the first part you can see that the Intel Tool, TaskManager and the MSI Tool can show me some differences to the frequency while Aida shows only 1200 or 4500 GHz. The other Tools show me little steps, but the steps are present. (When I reduce to a "one tool measuring" they rather bigger) Maybe that all other do an average calculation or whatever. Aida does not. In the middle time of the video I changed the energy saving plan from “maximum output†to “Balancedâ€. After this, the CPU steps are much more various and now Aida can see the steps. So your Test system seems to be in balanced mode too. I can’t tell you why Aida cannot recognize the smaller steps. I believe that it looks too much on the “Sleep State†then on the frequency itself, but therefore you are the specialist. ​Other Tools can see the smaller steps! The “break†maybe the wrong way or maybe obsolete for overclocking measuring of modern processors. The other tools present the data much faster and therefore more details? I don’t know. If someone other ask the same you can now answer him. If the system is in “maximum output “state by the energy saving plan, Aida can only recognize “Sleep State†or “Fullâ€, even when other tools show you other. If you change to an “balanced†energy saving plan Aida shows the same information as other tools. http://www.allesruff.de/Aida/perf_issue.mp4
-
So, my CPU does only a small numbers of steps, even if other Software Shows more steps?
-
OK, again. Other tools can, with the same Bios and same configuration. Why can Aida not? What is the different? It is not a question why it is for me beneficial. It is the question why you develop such a feature, so it must be beneficial for you. If you provide such a feature I expect that it works correctly. Are there more parts inside the software what I expect beneficial and you not? Or vice versa? I’m with you, if such a feature does not work within my configuration, it may be a board issue or something like that. But, other tools can do it the right way. So, there must be an issue on your side, does it? I think that the question about “beneficial†shows the way you see it. I buy Aida as “information†Software, I need the support for the overclocking! And first of all, it is my matter for what I need it. But, if it works correct I promise you that I tell you.
-
Ok, I understand. I think we go round in circles I want exactly this! “Aida can see the middle steps†but obviously not on my board Taskmanger see the middle steps, MSI can see the middle steps and of course on my board regardless any switches, configuration or something else. And your answer is that they are wrong but you not? Did you not think that this must be a failure by Aida and that it is not a failure by the other developers? What can I do that my configuration (and there is nothing special with) will also “show the middle steps†like your configuration mentioned above?
-
OK, for me as a "normal" Person this difference is irrelevant. You say, your method viewing on the BCLK is much more accurate then the method from another developer. Aha. So, and what is about the different between AIDA and the Taskmanager? And, you are right, the Taskmanager measure the same as the MSI Tool. So, you wrote some post before that you X99 Board will measure correct and show some differences between sleep mode and full performance. In my Video you can see that the Taskmanager will do, and the MSI Tool also. Why did Aida measure completely other on my board? Is this a board failure? Think not, because two other tool measure some difference. Only Aida will not. Please explain
-
And, before you stated, no, it is not driven by the beta version of Aida. ​The issue is the same even when I use the stable version
-
Hello, sorry for the delay. I have done some investigation into EIST and C1E and all other things that you have mentioned. But, it is still the same regardless I switch those things. The measurement in AIDA is still the same and obviously wrong. How funny is this clause of you: >BTW, MSI Command Center, at least on the shot you've linked above, doesn't seem to be all that accurate. 100.0 x 40.0 = 4021.7 MHz? I don't think so... And when a software is obviously inaccurate, I wouldn't use it as a reference in a discussion. ________ If you look at this Video you can see that AIDA is doing the same wrong calculation as you characterize in your completely wrong statement. In the Video you can see that AIDA will went to some different Values even if the “multiplication†is the same. So, why is your Software so inaccurate and how can we use it as a reference? Please look at this Video and please explain me the difference between Taskmanager and Aida? http://www.allesruff.de/Aida/cpu_boost.mp4
-
Thx. ​I look at that and give you feedback
-
How funny. I Have a look to a feature what Aida called „Overclock“ and you suspect that has something to do with overclocking. However, interesting answer. I will have a look to. If I disable C1E and Turbo Boost it changes between 1200 GHz and 3300 GHz without any steps between. I must investigate to TBM 3.0 To consider, the MSI Tool or TaskManager does not reflect in any way to this different states. They can see the different steps regardless my switches. Withou Turbo Boost, C1E disabled___________________________ CPU-Eigenschaften: CPU Typ HexaCore Intel Core i7-5820K CPU Bezeichnung Haswell-E CPU stepping R2 Engineering Sample Nein CPUID CPU Name Intel® Core i7-5820K CPU @ 3.30GHz CPUID Revision 000306F2h CPU VID 1.3019 V CPU Geschwindigkeit: CPU Takt 3300.0 MHz (Original: 3300 MHz) CPU Multiplikator 33x CPU FSB 100.0 MHz (Original: 100 MHz) North Bridge Takt 3000.0 MHz Speicherbus 1333.3 MHz DRAM:FSB Verhältnis 40:3 CPU Cache: L1 Code Cache 32 KB per core L1 Datencache 32 KB per core L2 Cache 256 KB per core (On-Die, ECC, Full-Speed) L3 Cache 15 MB (On-Die, ECC, Full-Speed) Motherboard Eigenschaften: Motherboard ID <DMI> Motherboard Name MSI X99A Gaming Pro Carbon (MS-7A20) (2 PCI-E x1, 4 PCI-E x16, 1 M.2, 8 DDR4 DIMM, Audio, Gigabit LAN) Chipsatz Eigenschaften: Motherboard Chipsatz Intel Wellsburg X99, Intel Haswell-E Speicher Timings 14-14-14-36 (CL-RCD-RP-RAS) Command Rate (CR) 2T DIMM-B1: Kingston HyperX KHX3000 4 GB DDR4-2133 DDR4 SDRAM (16-15-15-36 @ 1067 MHz) (15-15-15-36 @ 1067 MHz) (14-14-14-35 @ 1037 MHz) (13-13-13-32 @ 962 MHz) (12-12-12-30 @ 888 MHz) (11-11-11-27 @ 814 MHz) (9-9-9-22 @ 666 MHz) DIMM-B2: Kingston HyperX KHX3000C15D4/4GX 4 GB DDR4-2133 DDR4 SDRAM (16-15-15-36 @ 1067 MHz) (15-15-15-36 @ 1067 MHz) (14-14-14-35 @ 1037 MHz) (13-13-13-32 @ 962 MHz) (12-12-12-30 @ 888 MHz) (11-11-11-27 @ 814 MHz) (9-9-9-22 @ 666 MHz) DIMM-C1: Kingston HyperX KHX3000C15D4/4GX 4 GB DDR4-2133 DDR4 SDRAM (16-15-15-36 @ 1067 MHz) (15-15-15-36 @ 1067 MHz) (14-14-14-35 @ 1037 MHz) (13-13-13-32 @ 962 MHz) (12-12-12-30 @ 888 MHz) (11-11-11-27 @ 814 MHz) (9-9-9-22 @ 666 MHz) DIMM-C2: Kingston HyperX KHX3000C15D4/4GX 4 GB DDR4-2133 DDR4 SDRAM (16-15-15-36 @ 1067 MHz) (15-15-15-36 @ 1067 MHz) (14-14-14-35 @ 1037 MHz) (13-13-13-32 @ 962 MHz) (12-12-12-30 @ 888 MHz) (11-11-11-27 @ 814 MHz) (9-9-9-22 @ 666 MHz) DIMM-D1: Kingston HyperX KHX3000C15D4/4GX 4 GB DDR4-2133 DDR4 SDRAM (16-15-15-36 @ 1067 MHz) (15-15-15-36 @ 1067 MHz) (14-14-14-35 @ 1037 MHz) (13-13-13-32 @ 962 MHz) (12-12-12-30 @ 888 MHz) (11-11-11-27 @ 814 MHz) (9-9-9-22 @ 666 MHz) DIMM-D2: Kingston HyperX KHX3000C15D4/4GX 4 GB DDR4-2133 DDR4 SDRAM (16-15-15-36 @ 1067 MHz) (15-15-15-36 @ 1067 MHz) (14-14-14-35 @ 1037 MHz) (13-13-13-32 @ 962 MHz) (12-12-12-30 @ 888 MHz) (11-11-11-27 @ 814 MHz) (9-9-9-22 @ 666 MHz) BIOS Eigenschaften: Datum System BIOS 07/15/2016 Datum Video BIOS Unbekannt DMI BIOS Version 1.20 Grafikprozessor Eigenschaften: Grafikkarte Gigabyte GeForce GTX 1080 GPU Codename GP104-400 (PCI Express 3.0 x16 10DE / 1B80, Rev A1) GPU Takt 1328 MHz Speichertakt 2749 MHz With Turbo Boost_________________________________ CPU-Eigenschaften: CPU Typ HexaCore Intel Core i7-5820K CPU Bezeichnung Haswell-E CPU stepping R2 Engineering Sample Nein CPUID CPU Name Intel® Core i7-5820K CPU @ 3.30GHz CPUID Revision 000306F2h CPU VID 1.3019 V CPU Geschwindigkeit: CPU Takt 4499.8 MHz (Original: 3300 MHz, Overclock: 36%) CPU Multiplikator 45x CPU FSB 100.0 MHz (Original: 100 MHz) North Bridge Takt 2999.9 MHz Speicherbus 1333.3 MHz DRAM:FSB Verhältnis 40:3
-
Not yet funny as you expected in the beginning, isn’t it? I have paid for this and I want to use it. For me a “Information Software†does not have any emotional attribute how “like or not like†But, to use it I have the need to fully understand what it is doing. Ok, I have done your requested experiment and this shows, what wonder, the one Core presented me 4500 GHz during the Job, the others either 1200 or 4500 GHz. The MSI Tool can display me some different states, between these 2 measure points during the same job. So, the developer from this tool does not understand how modern processors work? Let us go away from the “break†discussion. I understand that fully. And if Aida wish to display the Sleep State correctly, be welcome. But, why Aida can never display any value between 1200 or 4500 GHz? (in my environment) Could you please explain this? The Intel Extreme Tuning Utility write: When the processor is operating below these limits and the user's workload demands additional performance, the processor frequency will dynamically increase in step sizes equal to the current reference frequency on short and regular intervals until the upper limit is met or the maximum possible upside for the number of active cores is reached. But, I never can see any of these “step sizes†in Aida. Why not?
-
Ok I see the experimental Clock Monitor. Same behaviour inside this panel, only 2 Values, min or max. Either 1200 or 4500, nothing more. And it will cause around 5% workload over all. Anyhow, different for each core. Ok, it is experimental but it seems to be an important Aida incapable issue. ​(PS: I never read before CORE 1 to 6, it is always CORE 0 to 5, isn't it?) At the same time the impure MSI Software shows me exactly what going on in my CPU with 0.3% workload! So, the answers to my questions seems to be very simple. 1. Aida cannot measure newly CPU exactly 2. If you measure, there will be a high workload to the CPU without increasing accuracy 3. It calculates nothing; it will always use the simplest formula (only one core is measured with baseclock X Multiplier) ​4. It uses a "break" to determine the exactly "Sleep State" moment without asking for ​5. Aida cannot report how often the sleep state will be occure 6. Aida cannot measure any modern CPU frequency between "Sleep State" and max. frequency Please, this is not what I expected from such a Software. From my point of view, this function is essential for monitoring overclocking. I see some posts inside your Forum asking for this feature. Please, have a look to such tools like MSI Command Centre and try to find out what these developers do other then you. (with much more accuracy by using very low workload). And then, please implement the same measurment to Aida. Until that, the overclock feature inside Aida seems to be complete useless. And, again, rename CPU Clock in this context to “CPU Sleep Stateâ€. What seems to be the right name for. In my environment the CPU Clock inside Aida shows me only how often the CPU went to Sleep State from maximum CPU Clock, nothing more.
-
Thx again for you answer. No, also with the CPUID Panel I can’t see any other then min or max. Indeed, the last two digits, included the decimal will show me some little differences like I wrote in my first post. And this is why I ask! Aida shows my different values (also in the CPUID Panel) 1200 1200.1 4500 4500.2 4499.9 Many other tools show me complete different values at the same time. Many other tools can show me the frequency of each Core and then they, maybe, calculate a complete other CPU Clock then Aida do. Of course. Is the Multiplier every time only in min/max state? (Is it all the time only switching between sleep/full? Aida think so?) Can Aida measure the multiplier of each core instead (of course in addition) of measuring only all cores? Can Aida calculate other than the simple way (basefrequency X multiplier)? (e. G. average between different clocks of each Core) Would you integrate this?
-
Ah, you think my Questions are funny. What is it? Is my English too bad? Again, I did not get other values then min or max. -You- wrote that Aida will have a “Break†before it measures the CPU Clock. So the “Break†lets Aida measure the “Sleep Sate†without prevent Aida for itself that this point will never be reached. I understand. But I will not measure that min CPU Clock to achieve the “correct†Sleep State instead of CPU Clock. This may be interesting but not as CPU Clock. Because I know what the min is (min frequency), it may be interesting how often the Sleep State will be reached, but not what the frequency is in sleep State. Nice if you add this as a new Measure point. Measured Sleep State Frequency and how often this Point is/was reached. So, if you “disable†the “break†before measuring I will get some other values then “Sleep Stateâ€, correct? This is what I mean with “please integrate a Checkbox for enable/disable the "break" Feature†Let the user decide if he wants to have the actual CPU Clock or the “Sleep Stateâ€. And yes, I understand that such a measurement will prevent the CPU to come at any time to sleep state because the measurement itself needs a min. activity. This is my problem, it does not! I never did see any other value then min or max, again 1200 or 4500 GHz, nothing between. And this during other tools report me complete different values. E.G taskmanager or the MSI Command Center. Pic. attached. So, obviously there are many different states between two measure time points. All other tools show my different values only Aida will show only min/max. Can you now see what I mean? The Question is, can Aida show me different values instead of min/max or not? And the explanation can’t be “we do like CPUzâ€, the question is how Aida can or shall do. Possible it is the wrong way to calculate only the multiplier with reference clock? Obvious other can do it better.
-
Thanks for the answer. ​So, this mean, I will never get another Value then min or max? ​Again, obviously the Win 10 taskmanager give me more Information then Aida, is this your intense? Could you please integrate a Checkbox for enable/disable the "break" Feature? ​On the other side, why does Aida only shows the max value instead of different states between min/max? ​Is this also a Feature? Again, please explain, how do you calculate the CPU clock? All of the other tools shows different values, some tools for each core (also taskmanager). And Aida shows only min/max? If so, this value is not “CPU Clock†it is then obvious only “CPU Sleep Mode yes/no†There is no way to show the actual CPU Clock of any available CPU instead of the calculated CPU Sleep Value? Or did I miss something?