Lexus
-
Posts
5 -
Joined
-
Last visited
Content Type
Profiles
Forums
Events
Everything posted by Lexus
-
I use the sensor panel on a second monitor which I have recently upgraded from 1080p to 4K. The sensor panel I previously used doesn't scale; has anyone designed/found a panel on here that scales well at 4K? I've done a quick search on this thread for 4K and 2160 but no results Thanks Please disregard... I have reloaded backup and graphics and guages have rescaled
-
Thanks for confirmation
-
Hi Fiery, Yes, they are both there. My question is how each metric is reported. You state above to OP that "core temperatures are measured by the CPU itself" meaning it is a more accurate/reliable report when measuring CPU temperature. My question is, are the CPU utilization metrics ('CPU Utilization', and 'CPU Utilization by core') reported in the same way? Is 'CPU Utilization by core' reported by the CPU itself? And 'CPU Utilization' reported by the onboard sensor chip, or just an aggregation of the utilization of each core? Meaning that, of the two metrics, 'CPU Utilization by core' is a more accurate/reliable figure as it's reported by the CPU itself? Sorry, I recognised after posting that this is not only off topic from OP, but also in wrong sub-forum!
-
Blimey, it's unusual that I can reply to a forum post from a google search without necro'ing (kinda, same year at least) ... On the OSD panel, there is the option for displaying CPU Utilization, and CPU Utilization by core. Is the same principle true with this metric as you explain above with the CPU temperatures? Thanks :)
-
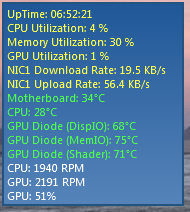
Edit: scrap the below... overlooked DLH007's text panel on p15 which looks an ideal template for me to work from. Hi all, I signed up just to comment ont his thread! There really are some really creative and beautiful panels on display here. However, after scrolling through 16 pages, there doesn't appear to be (m)any simplistic and minimalistic panels that have a 'sidebar' look (maybe 300x1035) that show simple critical values (in something other than dials) such as: Mobo temps CPU utilization, temps and fan speed Memory utilization and temps CPU utilization, temps and fan speed HDD utilization (not sure read and writes are measured by AIDA?) and temps NIC up/down rates and totals I care less about voltage displays because every component is at stock with no under/overclocks The full page 'pretty' designs with dials everywhere are great aesthetically but I (personal preference) would get lost glancing over mid game to identify the information that I'm looking to get in a split second. Can anyone point me in the direction of any posts/threads with images of something for me to get ideas from or, even better, an exported config file for me to import and work from? FWIW, to be displayed on right edge of my second 1080p monitor (125% scale) which is left of my main display. Attached is the gadget I used to use on Win7 but can't use it on Win10 anymore. Thanks Lexus