Yemble
-
Posts
17 -
Joined
-
Last visited
Content Type
Profiles
Forums
Events
Everything posted by Yemble
-
Easy... Open Services applet (it's within Administative Tools), locate Corsair Service, edit it and change the Startup type to Automatic (Delayed Start) You maybe correct in saying that this is a CoPro issue as I do not use one of these in my rig (I have zero interest in RGB), however, for me it is just a resource clash during Windows boot. Too many things going for the same hardware at exactly the same time.
-
I find this all very confusing! I have absolutely zero issues monitoring my H115i PRO (and my HX850i PSU) using AIDA64, that is the pump, the coolant and both fans. This is both with and without iCUE running concurrently. All I do is delay the start of the CorsairService during Windows 10 boot.

-
Yea, only when I disable both virtual NICs does AIDA64 show the correct Primary IP. Oh well, NP, as long as you are already aware of it...
-
I have VmWare Workstation installed on my PC, although I rarely use it. However, I have noticed that AIDA64 displays the Primary IP Address as one of the two VmWare virtual NIC addresses rather than the physical ethernet NIC address of the PC's wired connection. There does not appear to be any way in AIDA64 to select the correct NIC for the Primary IP Address.
-
Not able to cool i9-9900K with a 360mm CUSTOM LOOP!!!
Yemble replied to PABLO1234's topic in Hardware monitoring
80-90C is not unusual for the i9-9900K during stress testing. Note that the default thermal throttling temperature is 100C for this CPU, however, most OC guides that I've read suggest upping this threshold to 110C in the BIOS. Then you should never see throtting within AIDA64 stress testing. It is not clear to me, from your picture, where you are drawing air into the radiator from. If you can, then the best CPU cooling will be achieved drawing air from outside through a radiator at the front of the case and then exhausting out of the top. You can use PMW case fans to cool the other components. I cool my i9-9900K with a Corsair H115i AIO in a push-pull config at the front of my case. I can run AIDA64 stress testing all day long overclocked to 5.1GHz / PC3400 without ever seeing any thermal throttling. -
Works as expected in 6.00.5100. Cheers
-
AIDA64 Monitoring Corsair H115i PRO... Safe?
Yemble replied to Yemble's topic in Hardware monitoring
I've re-enabled the Asetek monitoring module and no issues with the radiator fans so far. iCUE seems happy as well. Can AIDA64 capture the coolant temperature sensor data from the H115i Pro, if so, what is the sensor called? Forget that, I was mis-interpretting Temperature #1 as a mobo sensor, when it was, in fact, the coolant temperature. Just ran the System Stability Test for two hours, no issues. -
NVMe Drives Disappear From OSD Panel During Temperature Update
Yemble replied to Yemble's topic in Bug reports
Sussed it In the Stability settings, the RAID SMART support option is enabled by default. Disabling this option stops the NVMe drive lines periodically disappearing, but crucially, it does not prevent the drives SMART data from being read, even though two of the drives are in a RST RAID-0 set. Note that I left RAID member enumeration enabled. This applies to the AIDA64 release version as well as the latest two betas. -
Perfect
-
AIDA64 Monitoring Corsair H115i PRO... Safe?
Yemble replied to Yemble's topic in Hardware monitoring
When I had the Asetek module enabled in AIDA64 I didn't notice any odd effects with the cooler fans. However, because I was still looking for a stable overclock at the time (and having read the Corsair forums), I decided to disable the Asetek module to avoid any possible red-herrings. Having this cooler info displayed in the OSD is preferable to using iCUE, IMHO, so I'll give it another go, now that I know what to look out for. If it fails, I'll report back to you... -
I have both AIDA64 and HWinfo installed on my new i9-9900K water cooled rig, HWinfo for its Rainmeter plugin and AIDA64 for its OSD. My AIO cooler is a Corsair H115i Pro, with the pump speed sensor plugged into the CPU mobo header. The other cooler sensors, temperature and fan speeds, use a dedicated USB connection direct from the pump head. Both HWinfo and AIDA64 can monitor these sensors, but the Corsair forums are full of warnings that doing so will conflict with their iCUE software, resulting in BSOD events. The advice for HWinfo, is to disable Asetek(!) monitoring altogether, for which there is a tick-box, which I did. I noticed that there is a similar option for Asetek within AIDA64. Am I correct in assuming that it does the same thing, for the same purpose? I am querying this, as initially I was monitoring the cooler pump and fan speeds (but not the coolant temperature) with AIDA64 and iCUE seemed to work perfectly well, ie. no BSOD. So now I am wondering whether, or not, this is a non-issue?
-
Yep, that's all I'm requesting.
-
NVMe Drives Disappear From OSD Panel During Temperature Update
Yemble replied to Yemble's topic in Bug reports
OK, how odd! I'll give the release version a shot when I get home. What sampling period do you have set for aquiring the drive SMART data? I'm sure I have it on the default setting (whatever that is). FYI, mobo is a Gigabyte Aorus Master running F9b BIOS. -
NVMe Drives Disappear From OSD Panel During Temperature Update
Yemble replied to Yemble's topic in Bug reports
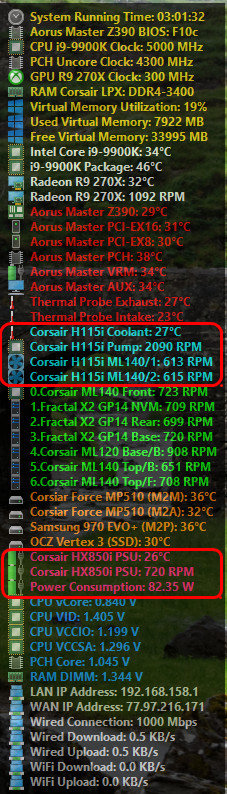
The two Corsair drives are in a RST RAID-0 set, however, the Samsung EVO is an AHCI Windows 10 OS boot drive. All three NVMe drives are affected, but not the older OCZ Vertex SATA SSD. All three NVMe drives are located directly on the Aorus Master motherboard, if that is relevant. Not tried the release version, as I had assumed that the beta would be "more advanced". Are you saying that the release version does not exhibit this behaviour? The thread title suggests that this is related to the aquisition of temperature data, however, I suppose that it is whilst querying the drive's SMART data. -
A disappointing response really. Quick and simple is exactly what I want and SensorPanel is anything but, which is why I am using the OSD. For me, OSD is the superior of the two options. Given that you have gone to the trouble of developing the OSD in the first place, why not complete the job and allow it to be locked on the screen... or is this too much like rocket science?
-
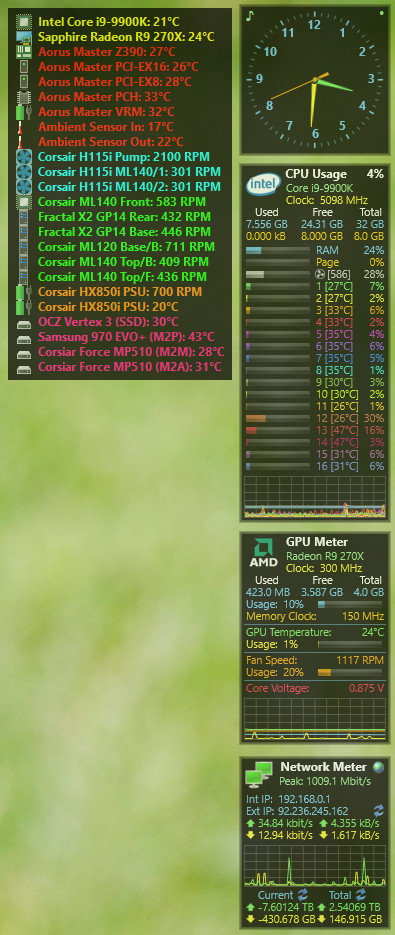
AIDA OSD panel cannot currently be locked on the desktop, which is a PITA. Why not implement a click-through option, exactly like Rainmeter, whereby mouse clicks are effectively ignored by the OSD, effectively locking it in place? In Rainmeter, CRTL/right-click displays the context menu of the gadget. Ref. screenshot, Rainmeter gadgets on right cannot be accidentally dragged, whereas AIDA OSD can.

-
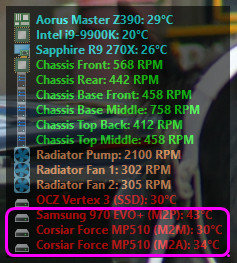
I use the OSD for monitoring system temperatures and fan speeds. I find AIDA64 the most convenient of (numerous) hardware monitors for just displaying a text list of specific metrics. However, I have come across one rather annoying attribute of v5.55.4992b, when listing NVMe drive temps. During each refresh cycle, the line display for my three NVMe drives (a Samsung 970 Evo+ and a couple of Corsair Force MP510s) disappears from the OSD and all of the lines below are shuffled up. A few seconds later, the three NVMe lines re-appear and the subsequent lines shuffle down again. Interestingly, this behaviour does not apply for my single OCZ Vertex SSD drive. Ref. attached snippet. Note that I have deliberately moved the NVMe drives to the bottom of the list to reduce the amount of jumping text! This is really irritating behaviour and is surely not intentional? Any chance of fixing this please?