Kodo28
-
Posts
12 -
Joined
-
Last visited
Kodo28's Achievements
")


-
Sensors numbers getting out of range (Gigabyte X570 Aorus Xtreme)
Kodo28 replied to Kodo28's topic in Bug reports
Happen again just now. Logs on attachment isasensordump_good_after.txt isasensordump_bad_reading2.txt -
Sensors numbers getting out of range (Gigabyte X570 Aorus Xtreme)
Kodo28 replied to Kodo28's topic in Bug reports
Hi Fiery, Please find on attachment requested logs. isasensordump_Readings_OK - Is before issue happen isasensordump_Bad_reading - when issue occurring isasensordump_good_readings_after_fix - Once fix done by launching Hwinfo64 To give you a little more context, the issue happens randomly meaning Aida can work fine for hours and then suddenly it will show wrong or N/A info on some sensors, while all other tools like GPU-Z, HwInfo, SmartFan...will all still show good reading and all matching to each other. Bad reading ------[ LM78 ISA Sensor Device at 0A40 ]------ 0000 13 10 00 C0 DF FF 4B 20 FF 98 48 40 B0 FF FF FF 0010 1E 80 41 00 28 80 41 00 32 84 41 00 64 00 02 00 0020 1E 80 01 00 28 80 01 00 32 A4 01 00 64 EB F0 80 0030 1E 80 01 00 28 80 01 00 32 A4 01 00 64 21 F3 01 0040 1E 80 01 00 28 80 01 00 32 A4 01 00 64 00 00 00 0050 1E 80 41 00 28 80 41 00 32 84 41 00 64 FF FF FF 0060 7F 00 00 00 7F 00 00 00 7F 00 00 00 7F FF FF FF 0070 4C 4B 00 00 00 00 00 00 00 00 FF 46 1C 01 00 C0 0080 FF FF FF FF FF FF FF FF 00 00 00 00 00 98 00 00 0090 00 00 00 00 FF 10 10 10 42 99 00 00 01 5B F2 1F 00A0 00 14 41 46 1C 01 00 D0 7F 7F 96 80 00 00 0F 98 00B0 83 00 82 78 7F 7F 83 00 5A F0 3C 3C 3C 3C 3C 3C 00C0 FF FF FF FF FF FF FF FF FF FF FF FF FF FF FF FF 00D0 FF FF FF FF FF FF FF FF FF FF FF FF FF FF FF 01 00E0 FF FF FF FF FF FF FF FF FF FF FF FF FF FF FF FF 00F0 FF FF FF FF FF FF FF FF FF FF FF FF FF FF FF FF 0029 002A 002B T: 164 1 0 T: 164 1 0 T: 164 1 0 T: 164 1 0 T: 164 1 0 T: 164 1 0 T: 164 1 0 T: 164 1 0 T: 164 1 0 T: 164 1 0 Let me know if you need anything else isasensordump_Readings_OK.txt isasensordump_Bad_reading.txt isasensordump_good_readings_after_fix.txt -
Sensors numbers getting out of range (Gigabyte X570 Aorus Xtreme)
Kodo28 replied to Kodo28's topic in Bug reports
Hi Fiery, Thanks for the feedback, I will do that and post here the results Sometimes numbers simply stop to be shown (N/A or 0) like on 1st video or they can also swing all over the range and they are never the same ones. Strangely the ones from GPU tend to be ok while all others can be affected by the issue. https://youtu.be/hvRMQ5CV4ko -
Sensors numbers getting out of range (Gigabyte X570 Aorus Xtreme)
Kodo28 replied to Kodo28's topic in Bug reports
Hello, Coming back into this issue This bug still happening on latest version, while all my other apps like HWinfo are showing temps being reading without any issue. Can be this investigated? https://youtu.be/CQ8v6B81nlo -
Hi guys, Would be great to see dark mode on Aida64.
-
Many thanks All working fine now !!!

-
Hi, Aida64 Extreme is not displaying new AMD 6950XT GPU temps. Tested with other 3rd apps and all are showing temps
-
Come on guys, any update on this ? ? You're right about those points. We'll work on the Alerting module to make it more flexible and more usable in the upcoming weeks When can we expect to have the timing in alerts interval to be changed to minutes and not 1 hour interval ? Would also be great to integrate a kind of logfile or at least a note on which alert item, was the culprit for example when "shutdown the computer" option is selected and are many Alert Items. Tested this and there is no way to check which of the items was in cause of the shutdown when logging back.
-
Sensors numbers getting out of range (Gigabyte X570 Aorus Xtreme)
Kodo28 replied to Kodo28's topic in Bug reports
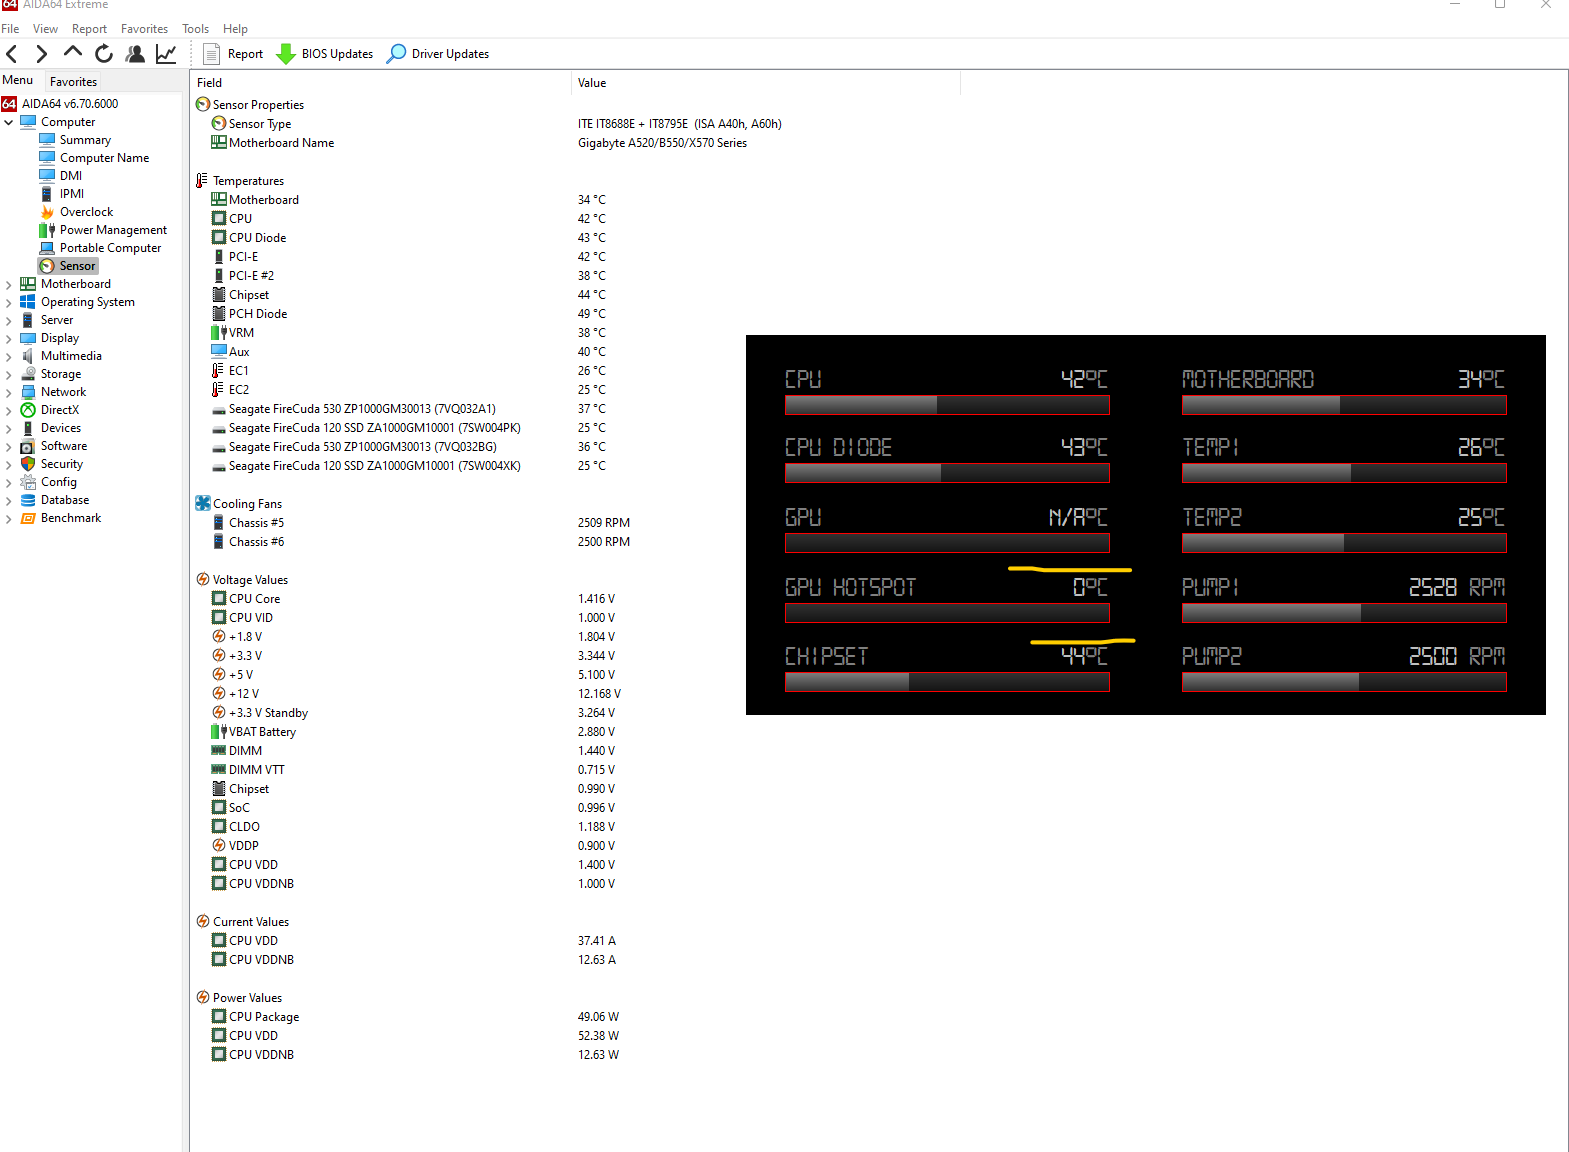
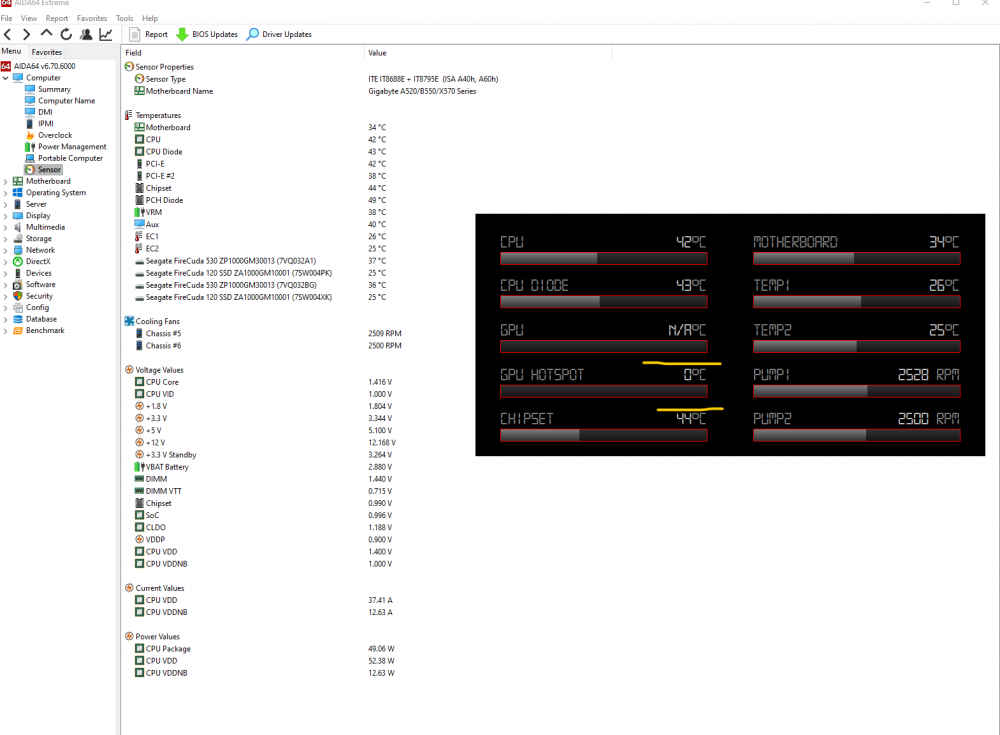
Aida64 is since some time now, providing sub temps on different sensors. This is starting with no apparent reason and can remain like that all time system is on and sometimes it will come back to normal temps readings also without any action. Restarting the application itself doesn't make any changes but strangely I've found that opening HWINFO will some how fix the readings in Aida64. Just that you know, test has been done on system without HWinfo64 installed and Aida64 still has the issue same also with SIV (which I do not use this last one anymore since my last post). Issue is also still present on freshly installed windows. Please check below video of case scenario. It is like if Aida64 was loosing communication with sensors and by opening HWinfo64 will bring communication back. This issue has been happening since sometime now and it is quite disturbing due that I use Aida64 for constant monitoring on secondary display on system case. https://youtu.be/Yr0ZeC3t_Jo -
Sensors numbers getting out of range (Gigabyte X570 Aorus Xtreme)
Kodo28 replied to Kodo28's topic in Bug reports
1) Issue happen even with SIV disable. 2) Not related with PC going to sleep mode. It happens randomly and not launching any specific app. It can happen just by web browsing. 3) Board is x570 Aorus Xtreme. Rev.1.1 I've sent also an email to support because now, CPU diode temp field just started to show N/A and not showing anymore on the TEMP listing. Cheers! -
Hi, I am facing some weird issue with Aida display wrong temps after running fine at first. For some reason Aida bugs out and start showing temp number all over the place after some minutes or not showing them in APP at all but showing "0" on panel. From gigabyte SIV tool no issue, temps are well shown, so not an issue with Motherboard sensors. Example below; Motherboard showing temp -92 °c...Chipset -6°c and CPU is not display on app, but shown on sensor panel at 0°c Meantime on Gigabyte app all seems ok