miked
-
Posts
12 -
Joined
-
Last visited
-
Days Won
1
miked's Achievements
")


-
Here is the sensor panel and background I used. I don't have it sized to 800x1280 but with a bit of effort you should be able to resize the background's and gauges. sensorpanel_V2.9.sensorpanel
-
Yeah, nothing to do with weather where I am...it's still "winter" here (Canada) and my office room temp is set at 21c so the outside temp doesn't really influence my ambient temps. For surely Aida is pushing my temps up anywhere from 8c to 15c when I have it running. Currently idle at 50c...Shut it down and my temp falls to 39c in less than 30 seconds (I have Aorus LCD display on my AIO). Start it back up, and spike to 56, settles back again at 49c in about 15 seconds or so. I'm just coming to grips with a couple facts...1, I got a really bad chip...I mean, this 5900x runs so hot and benchmarks are terrible for it...even after trying negative offsets using pbo2 I am actually considering an RMA with AMD for it. And 2, I can live with the increased temps because there is more value running Aida than not running it.
-
Yeah I found it a bit weird too...I wonder if it is all the graphics/gauges I am using on my panel? It is a bit 'busy'. I'm currently idling at 42 with a few browser pages opened and Aida closed completely. It wasn't until I recently started building a new Sensor panel I noticed the high temps. I am going to turn on the logging and leave it for a bit, then shut logging off and back on to create a new log file and start Aida64 app and again leave it for a while just to see what the impacts are.
-
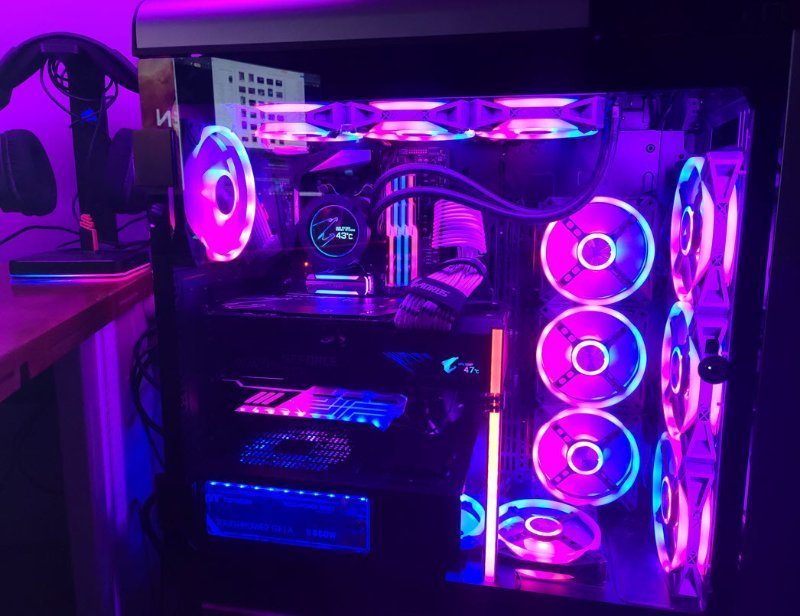
Hey folks, I recently noticed my CPU (5900x) was idling quite warm after updating my sensor panel. My regular CPU idle temps are high 30's to mid 40's and with Aida64 running it idles mid 50's to low 60's which is a bit concerning...I am using a 360 AIO and have a monster sized case with a lot of airflow. Are there some settings in Aida64 I should be disabling to reduce the impact or something else I should be looking at? Thanks.
-
 miked changed their profile photo
 -
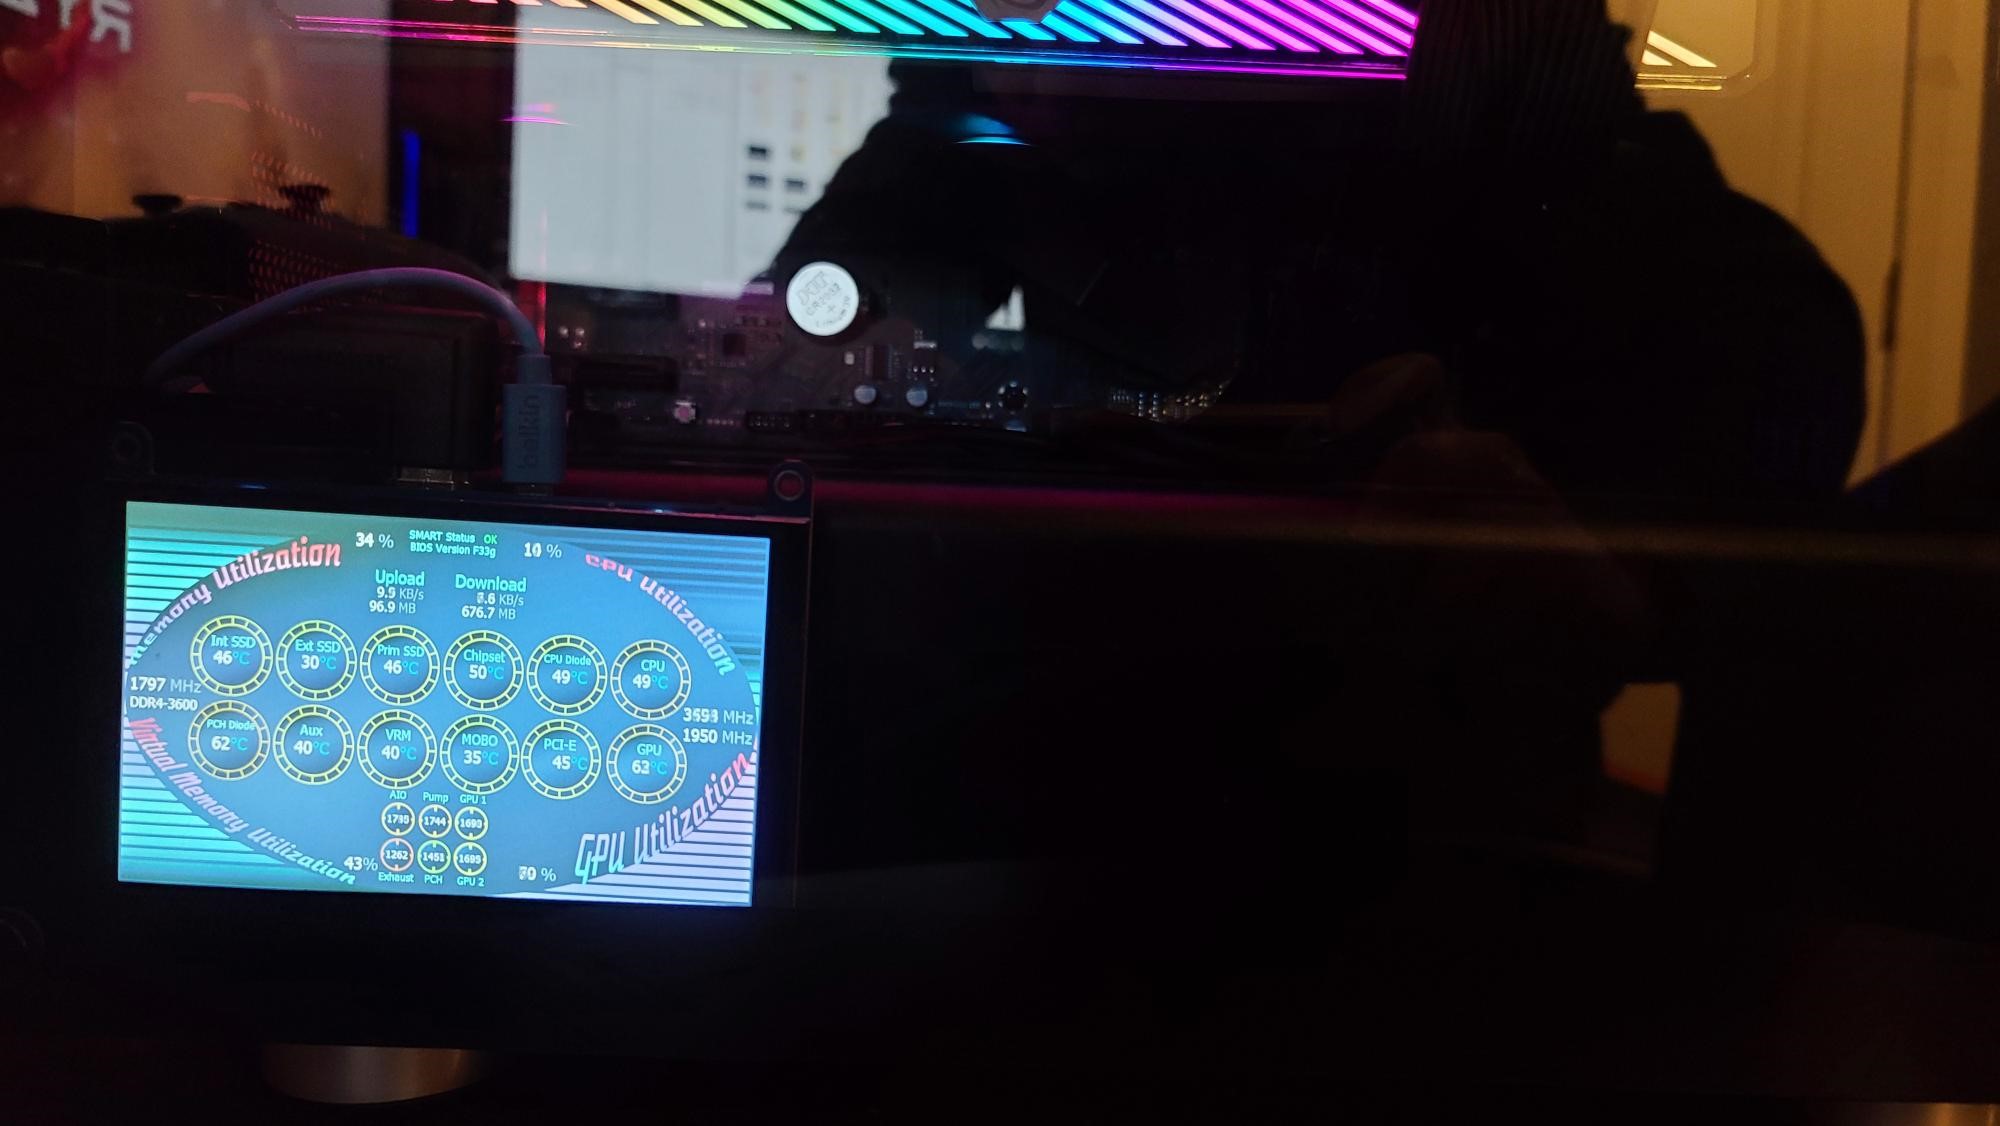
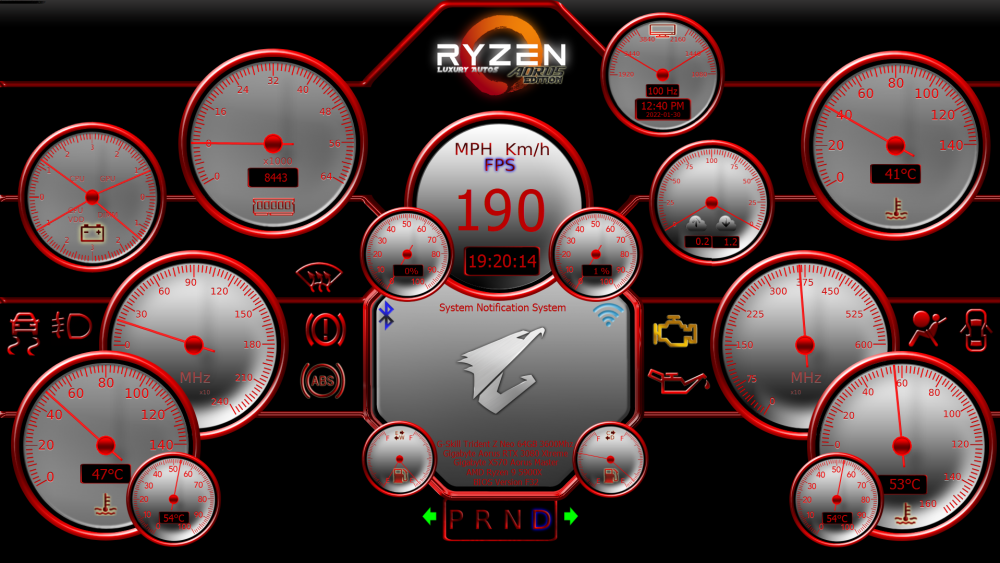
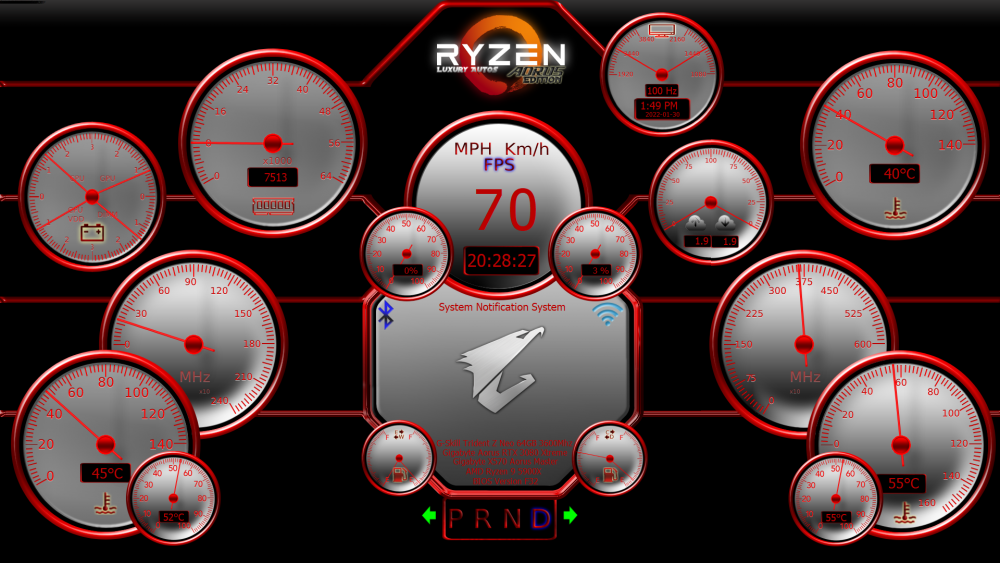
Just finished up my newest dashboard. Spent a ridiculous amount of time creating the gauges and images for this thing. There are a few of the graphics I still need to tweak or fix up a bit. The engine warning icons I created only pop up when some type of event happens - For example the low oil icon will display when the GPU Temp > 80. I set all the targets of these to 0.001 to illustrate how it looks when all the warnings are on but under normal operating each of these has their own target settings.
-
Hey, any chance you wanna share this panel?
-
the original background and others are attached to my initial thread and the threads you have responded with - you should be able to save those to your pc with the correct resolutions.
-
Hey looks great, would you share your panel?
-
Built this 800x480 for a 5" display I picked up. I spent a bit of time and built all the gauges for it so hopefully others can get some use from them. Creating custom graphics is not my forte...yet. If there is anyone here gifted with creating custom graphics and has a bit of time, I have a few ideas I want to spin off to see how it could be accomplished. SensorV4_31.sensorpanel

-
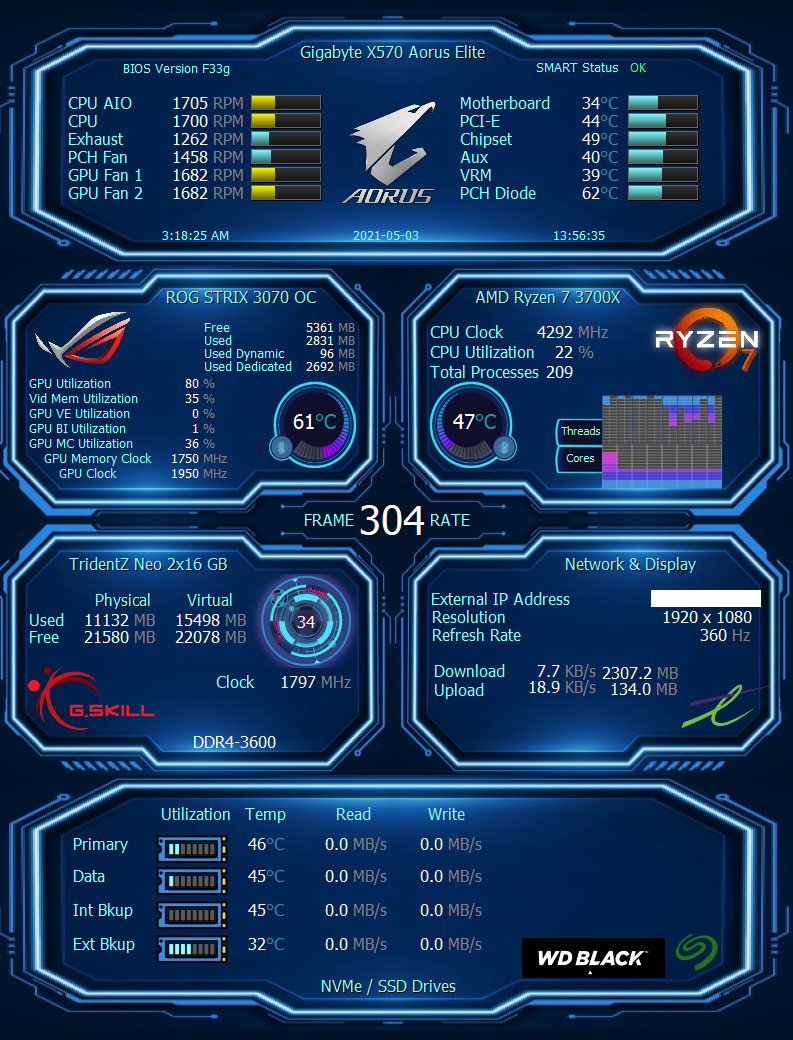
@striker1703 The 800x1040 is shared in the post above. You will need to change the file type to .sensorpanel and then import it - it changed the filetype to that ".dfe..." when it uploaded. Cheers.
-
Hey, attached is the Sensor Panel and blank backgrounds. I picked up a 5" lcd screen and just trying different ideas of how to fit this into 800x480. I included the 800x480 if anyone has any ideas. I have a couple other ideas I am playing around with using photopea for custom graphics but I am far from gifted using graphic software and it'll be a while before I get those rolled out. SensorPanel_V1.3.9_sensorpanel.dfe2c01f755aa5dfa56da9c40af81d70


-
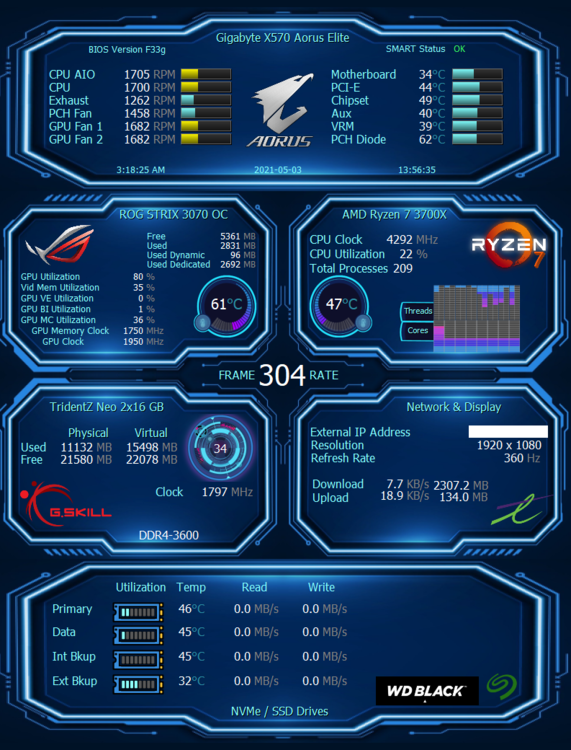
My first PC dashboard. Thanks to those that put the effort into creating some of the gauges I used. It is 800x1040 which fits nicely on a third 1920x1080 spare monitor I have with another app open to use the remaining screen space. I created some bar gauges for the CPU Cores/Threads but it looks a bit chunky and I am not a fan of it (I don't recommend Paint 3d and Snag it for creating these). I got a bit carried away and maybe too much info on here. I plan to reduce it when I can get a 7" display built for the PC.