

mrcl
-
Posts
12 -
Joined
-
Last visited
Content Type
Profiles
Forums
Events
Everything posted by mrcl
-
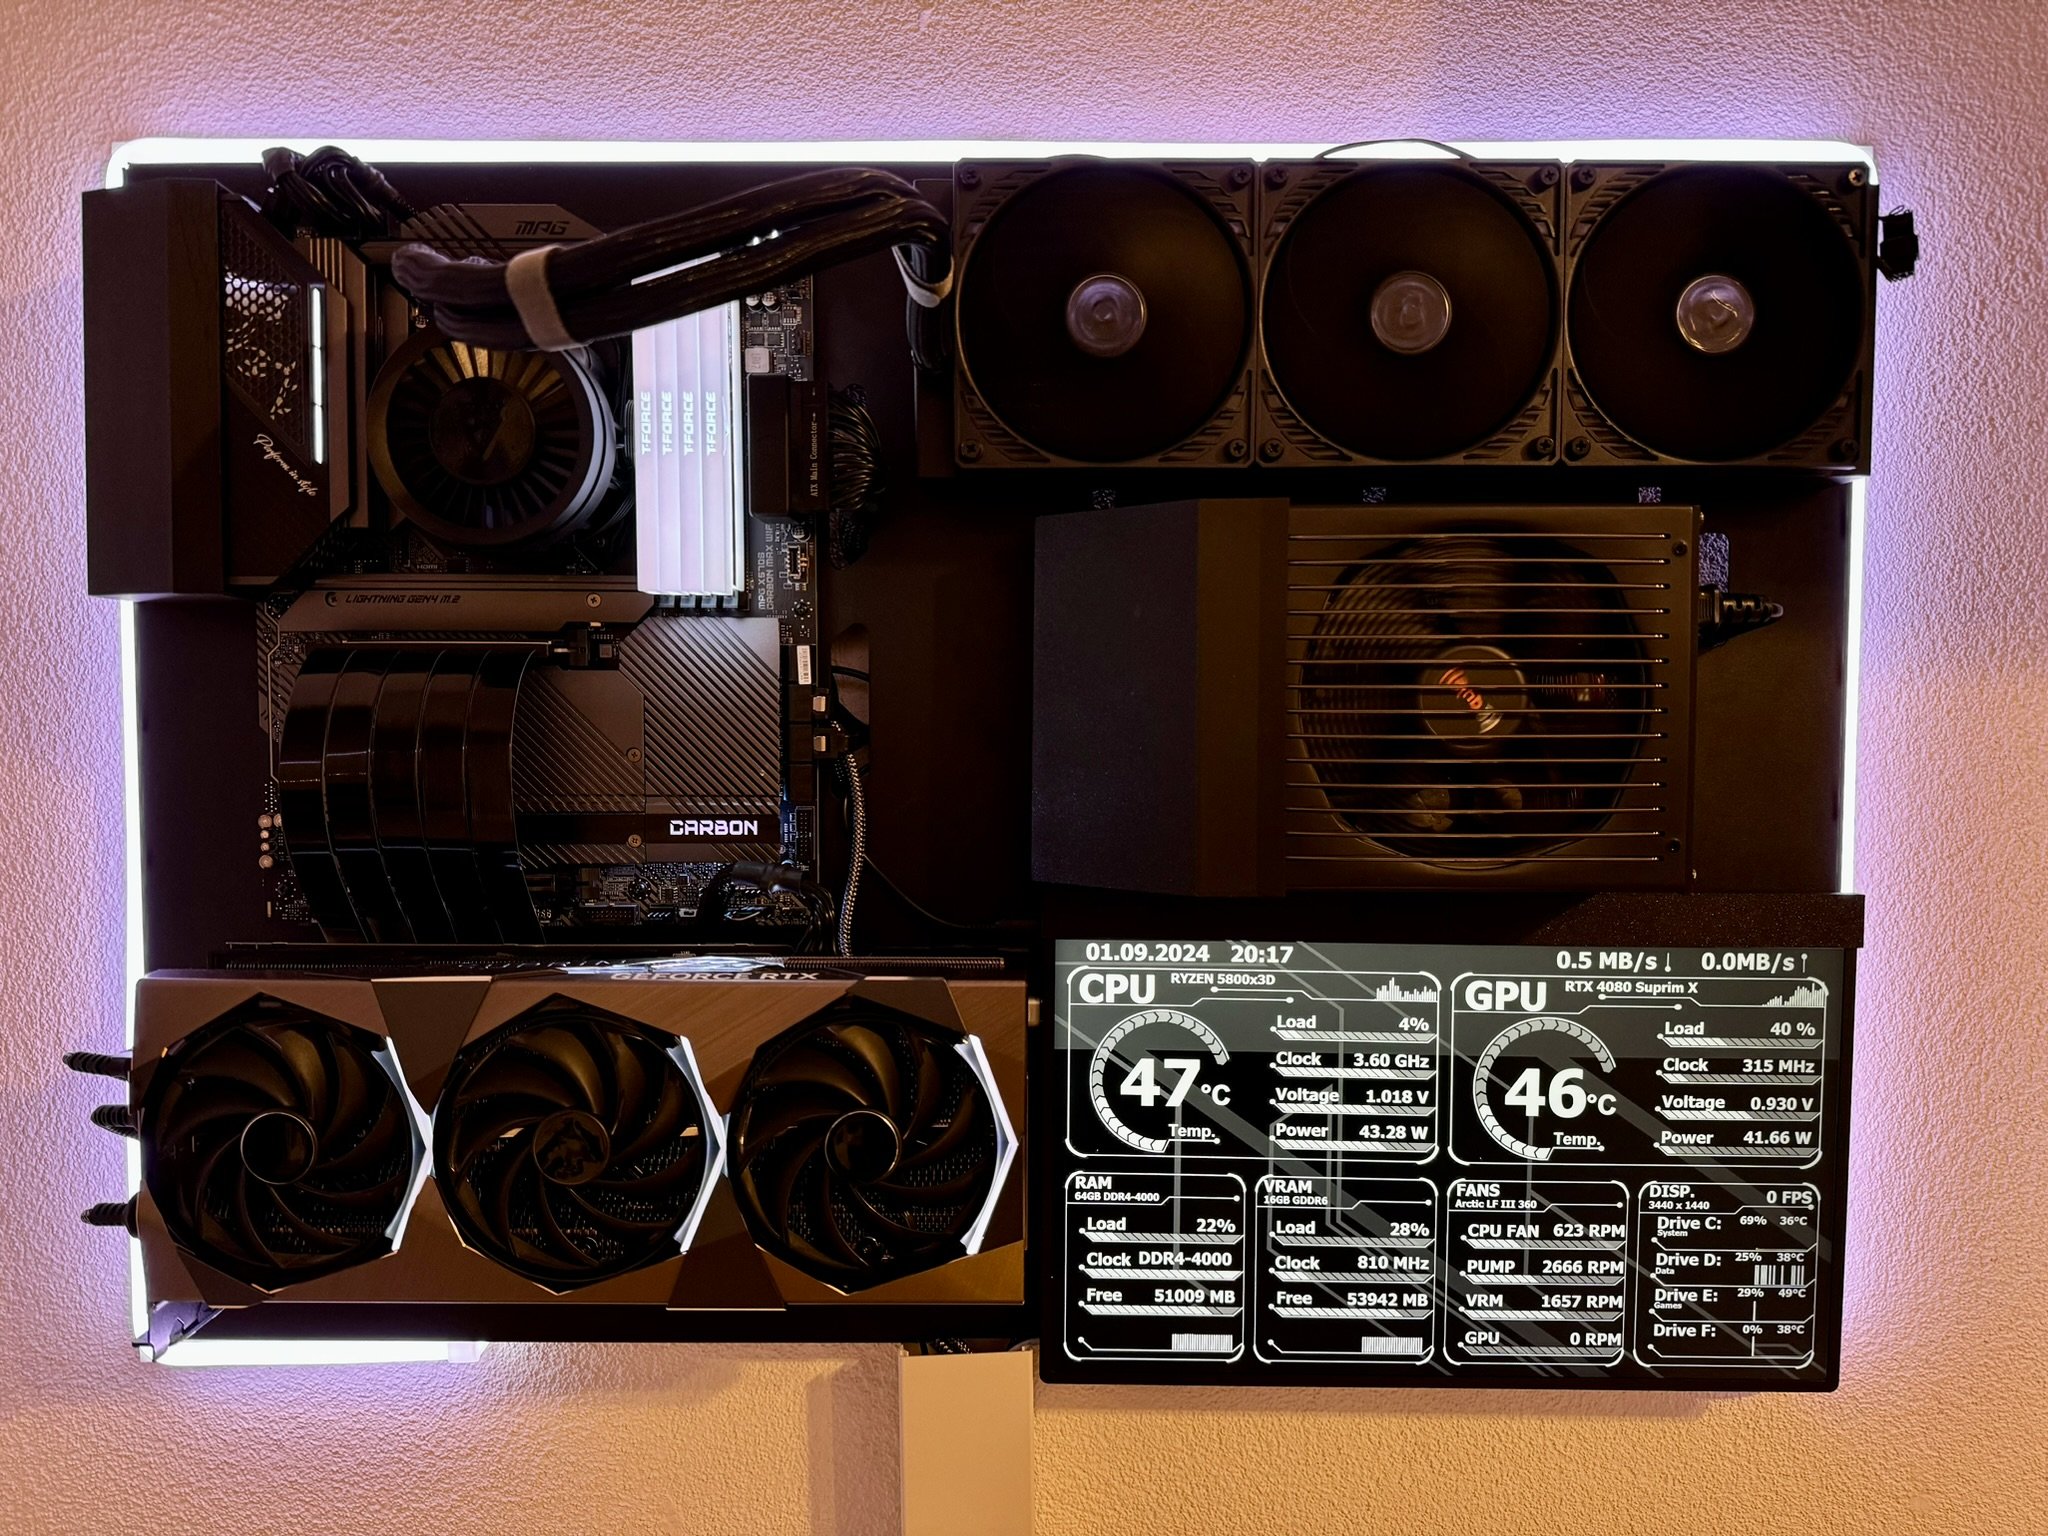
STAY TUNED I’ve been working on a desktop hardware monitoring dashboard powered by AIDA64, and I’d like to share it with the community for free, for now. Two designs are currently ready: Timber and Japanese Industrial, both made for 1920×1080 displays. Each includes five pages—System, Board, Cooling, Memory and Storage—with live temperatures, hardware utilisation, fan speeds, memory usage, drive information and network download/upload rates. Features include: Animated fan icons and live graphs Editable sensor assignments, labels and layouts Manual or automatic page switching Fullscreen display and optional startup with Windows Settings import and export The panels run locally in your browser using a small background bridge. AIDA64 is required and isn’t included. Sensor availability depends on your hardware, so you may need to adjust the assignments for your PC. Free to use for now—feedback and screenshots of your setups are welcome! Preview of the existing Panels "Jpn. Industry" "Timber"
-
*removed*
-
Thanks. I’ll probably do it later, but there are still a few things I need to improve before I can publish it with a clear conscience. In the mean time, I am working on different Themes in the background too, so I'd rather release a full package instead of one by one.
-
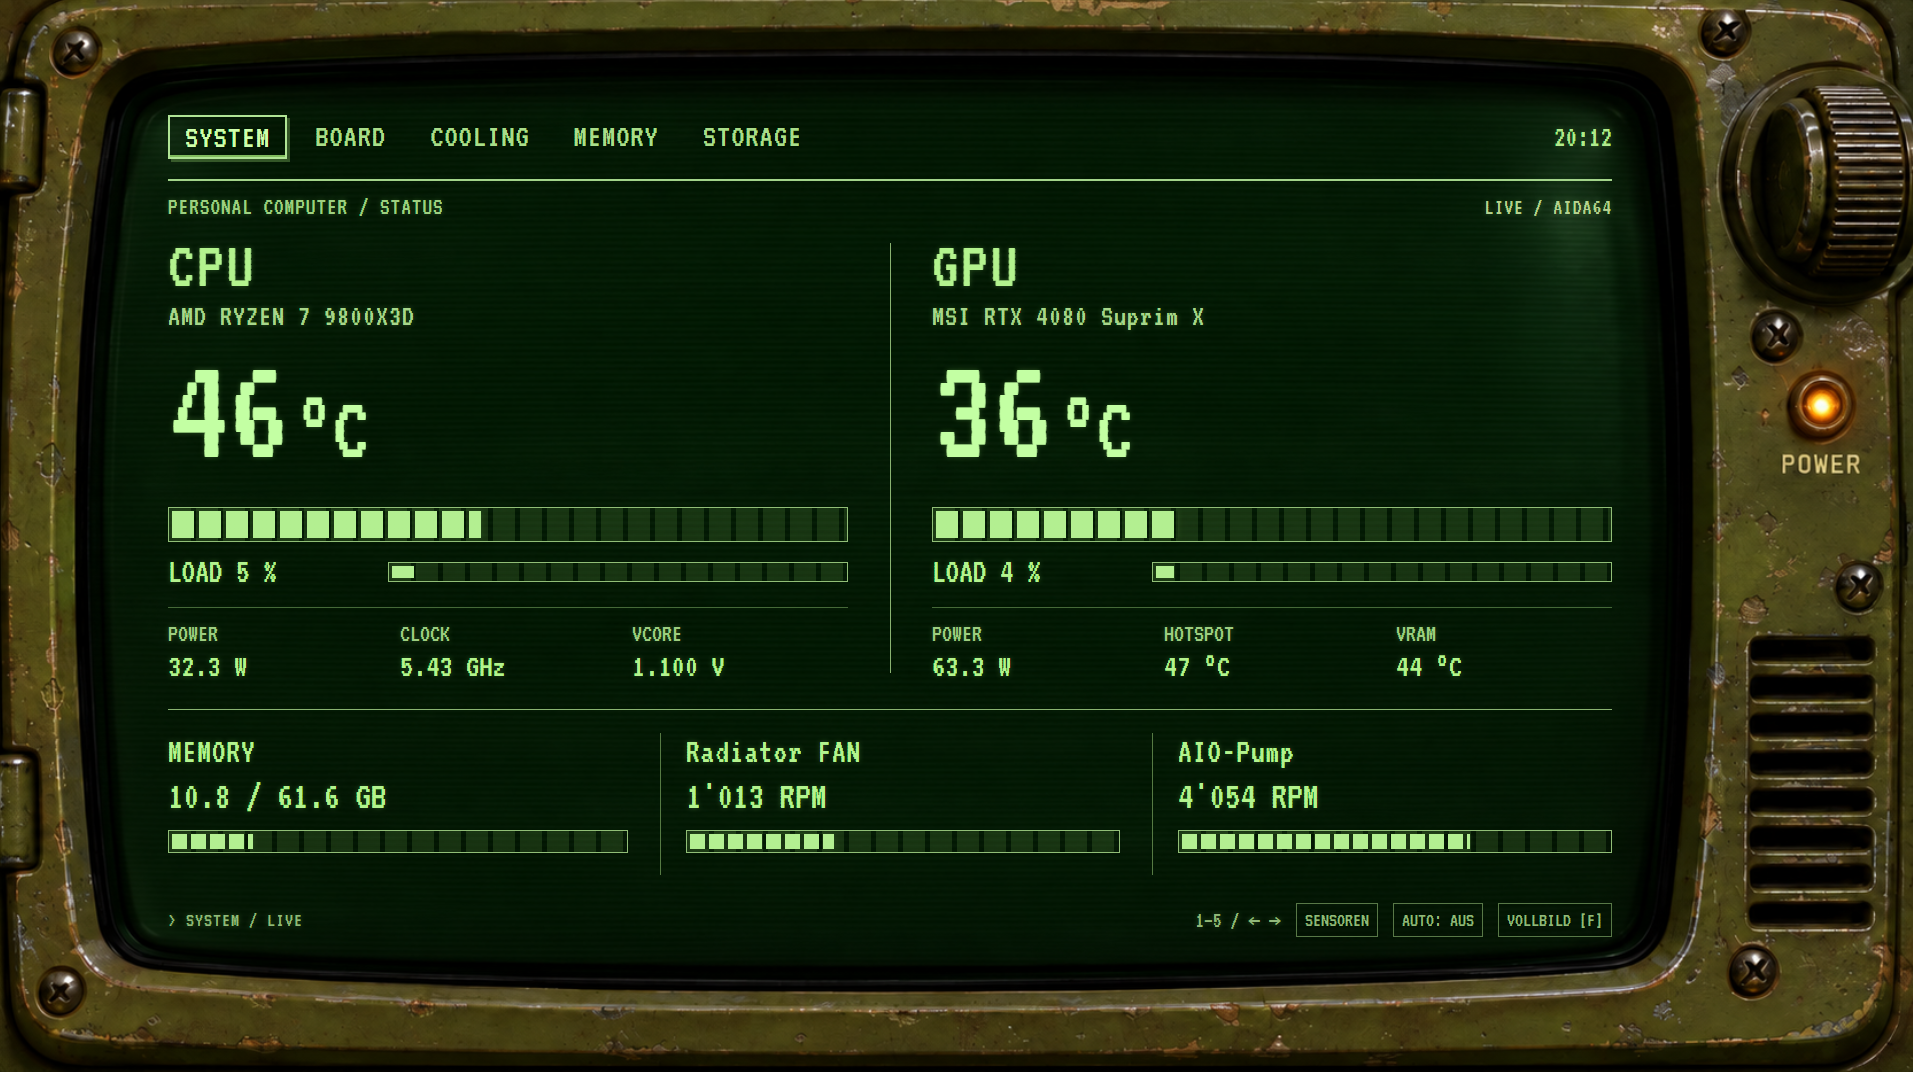
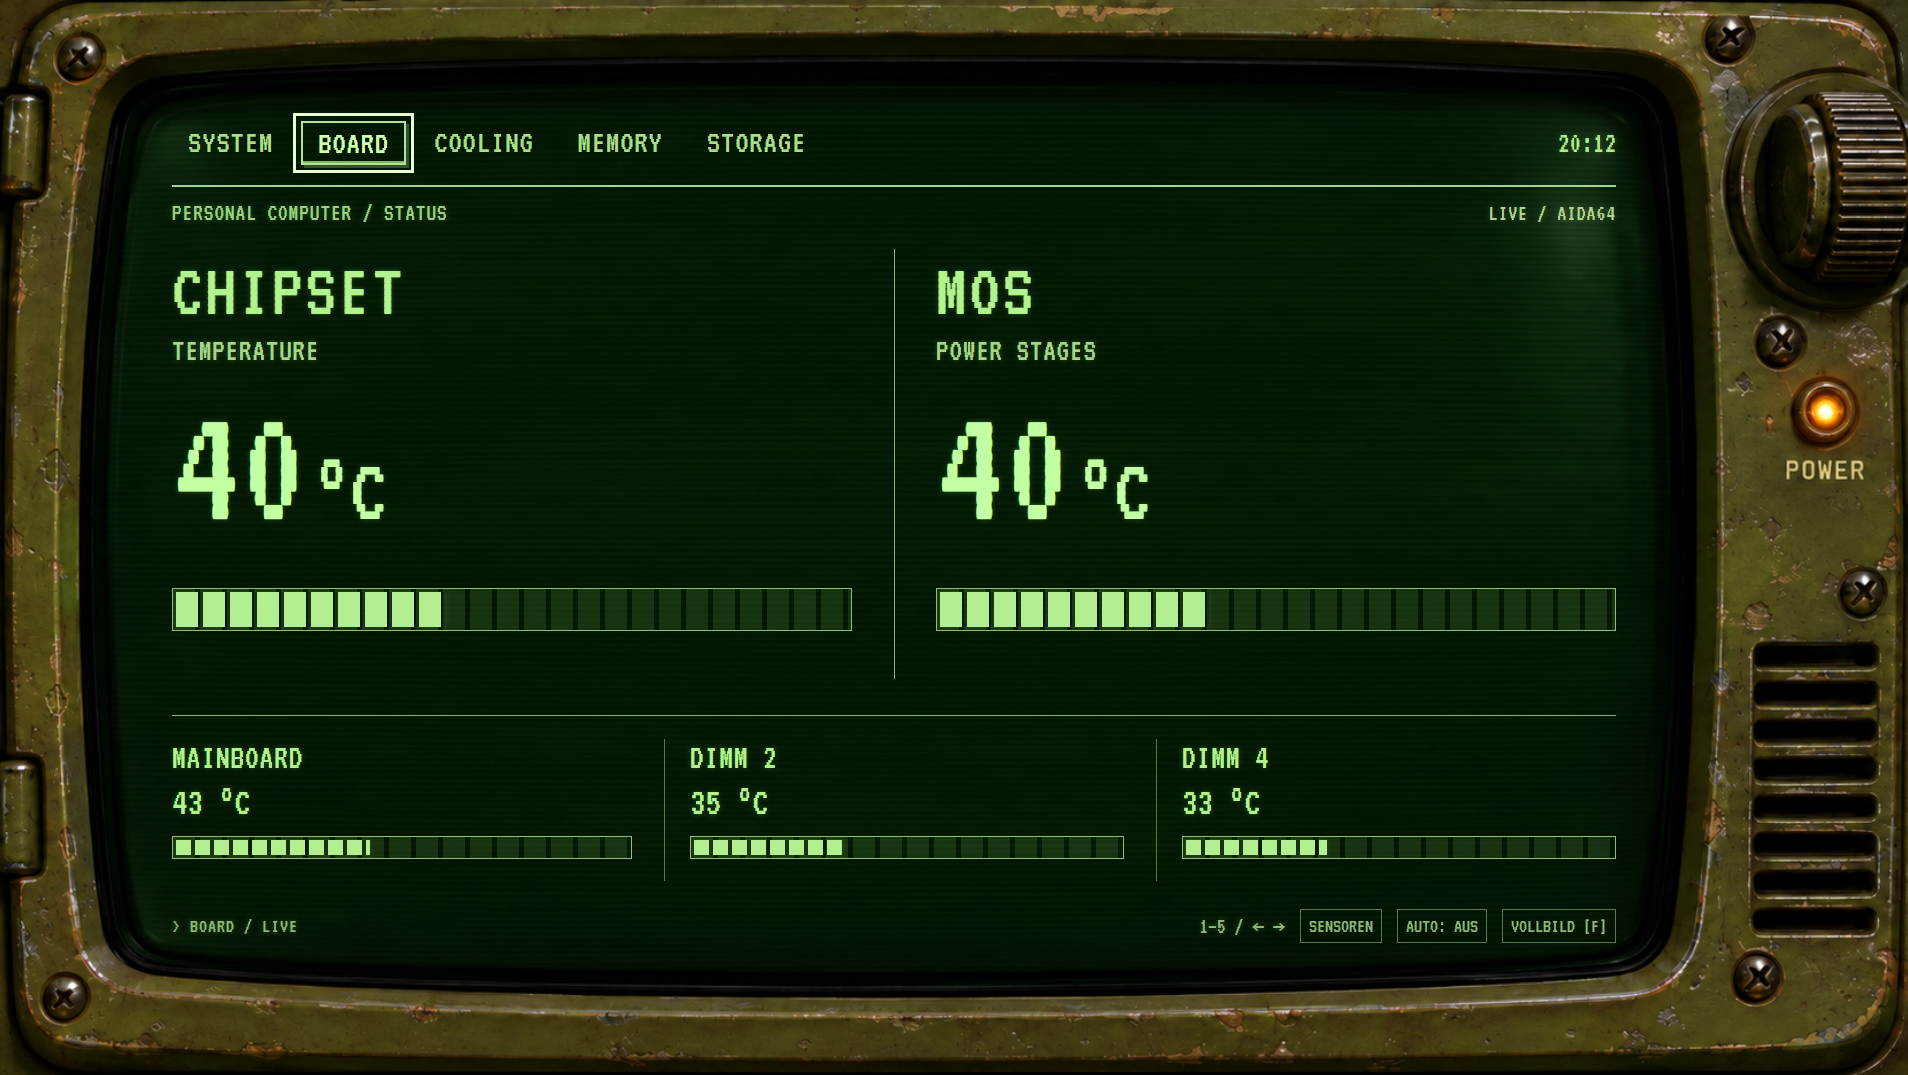
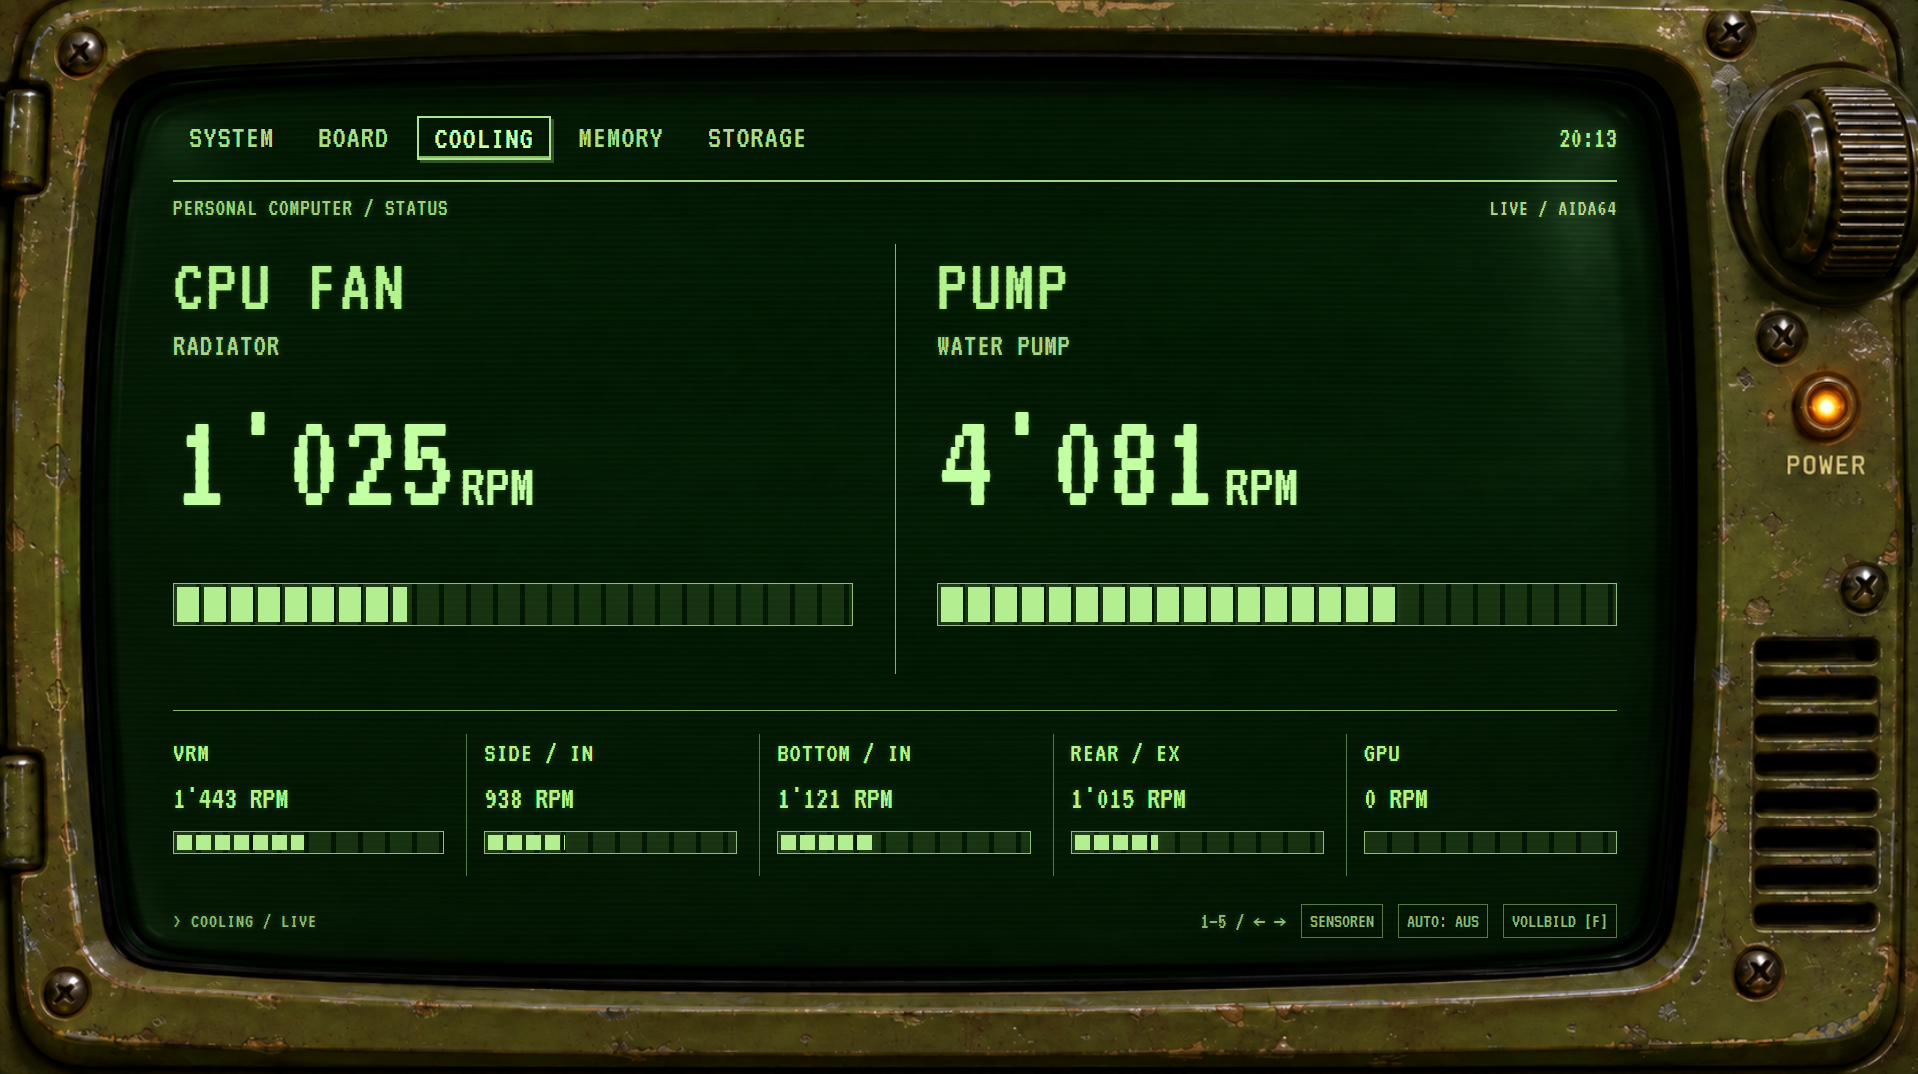
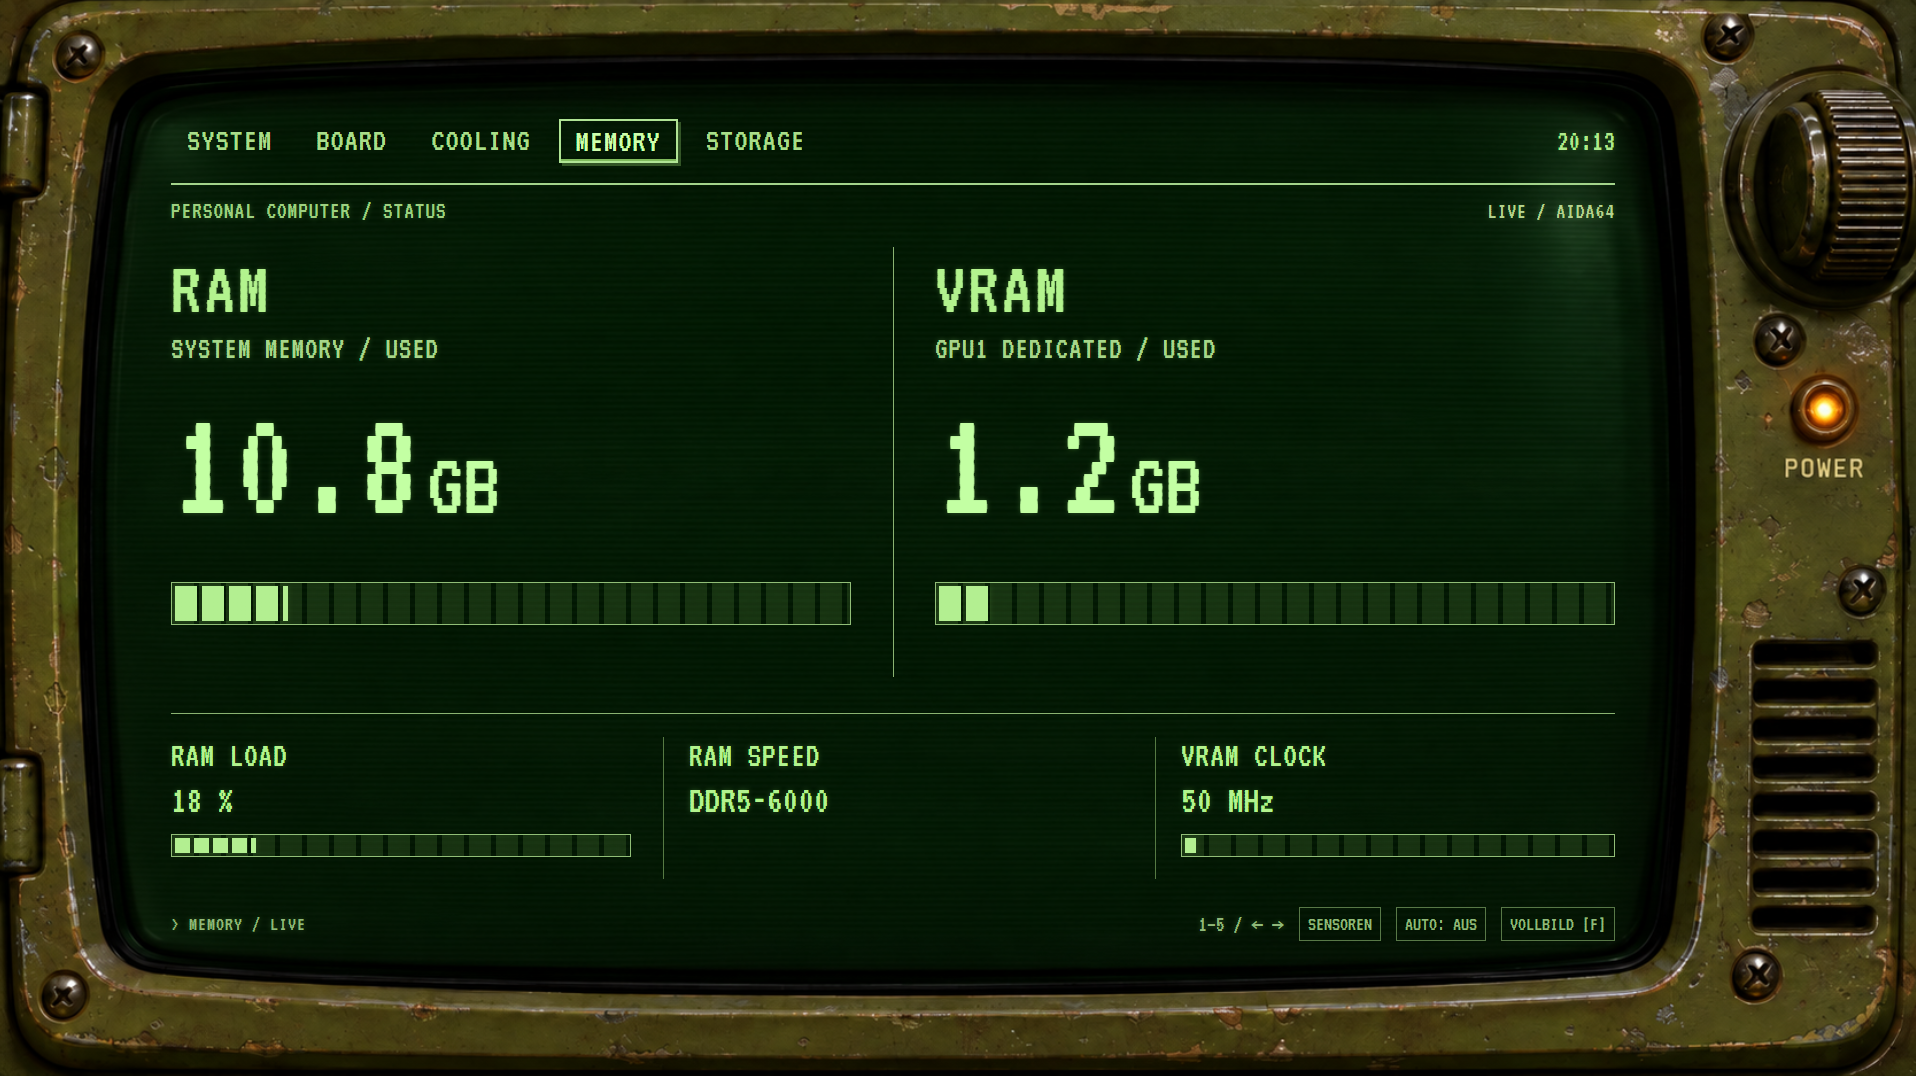
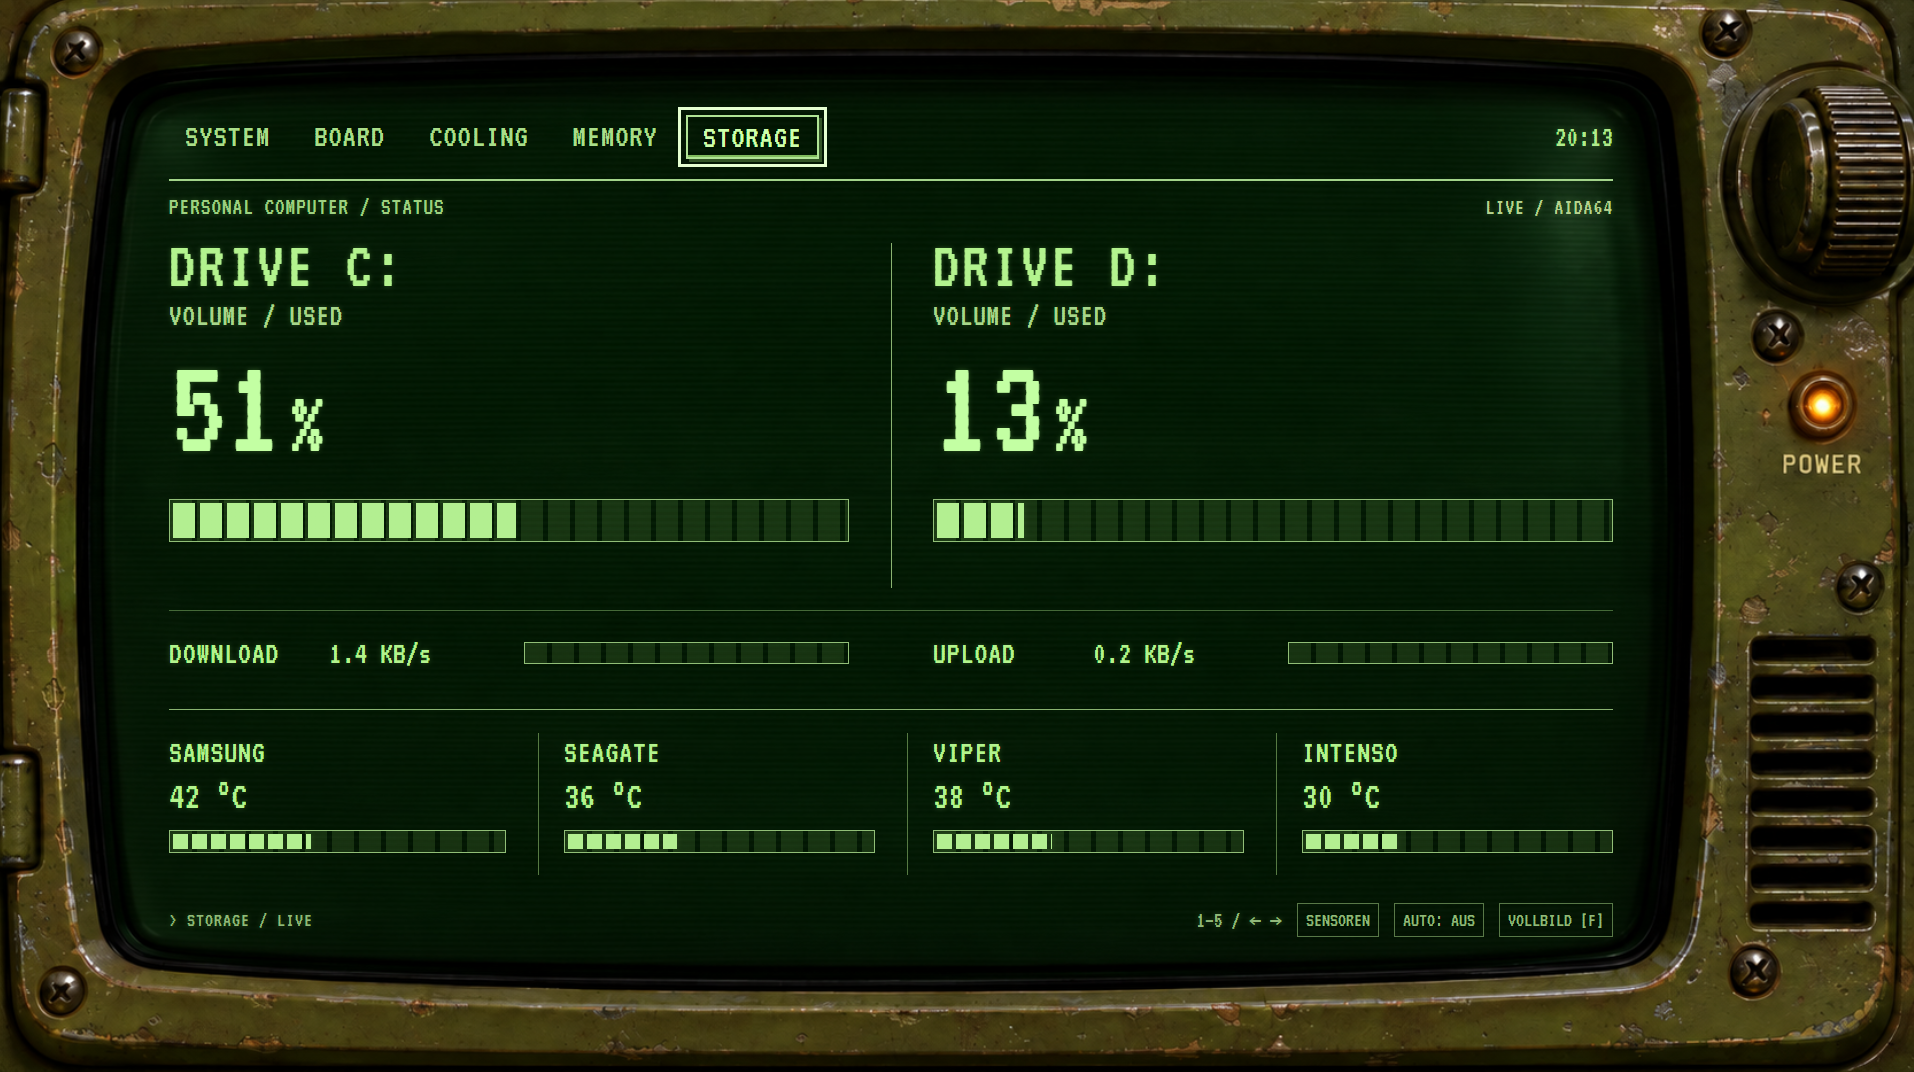
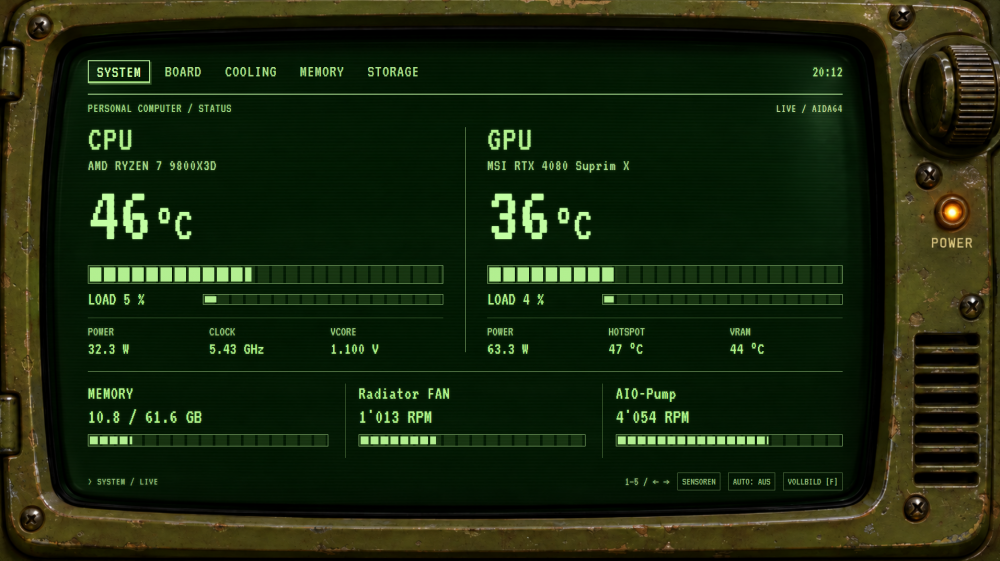
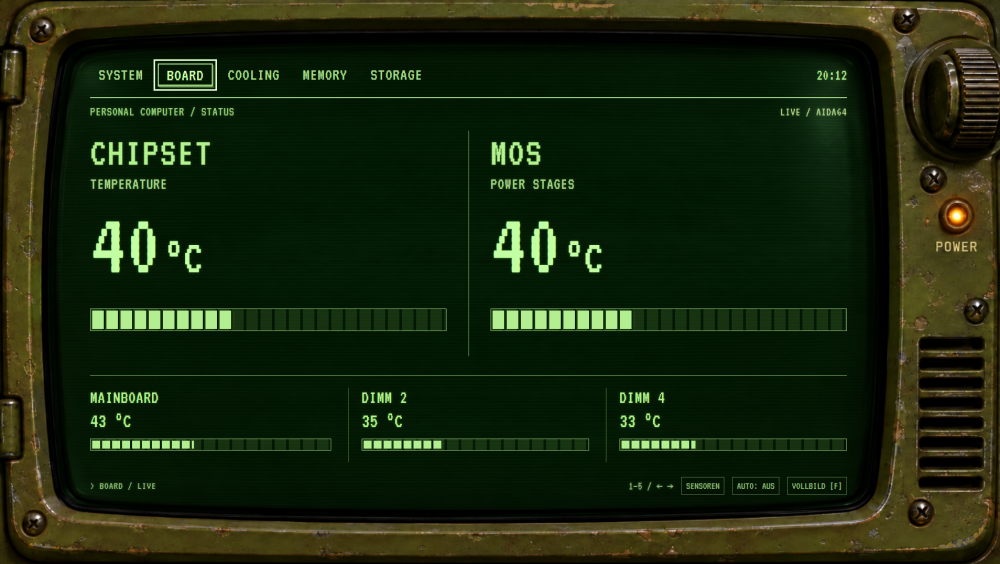
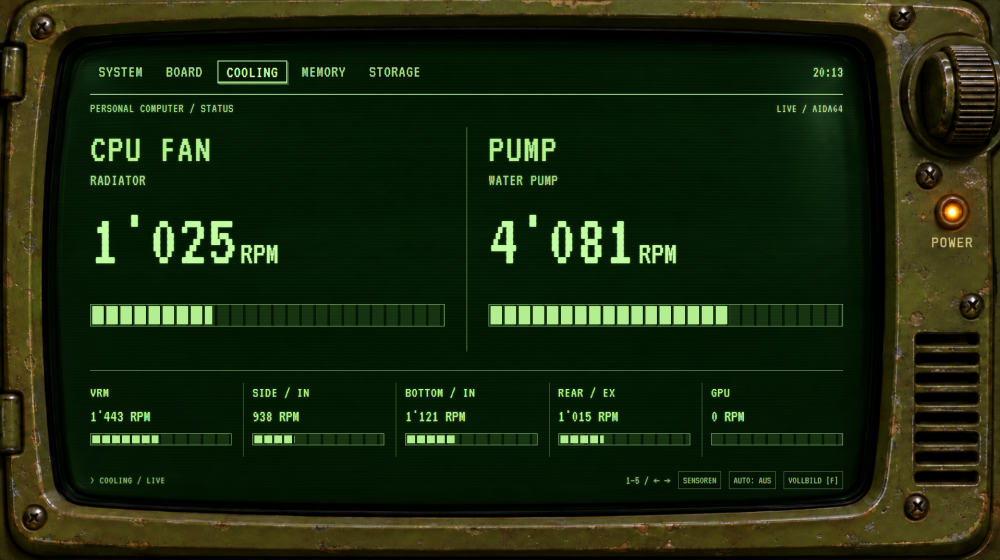
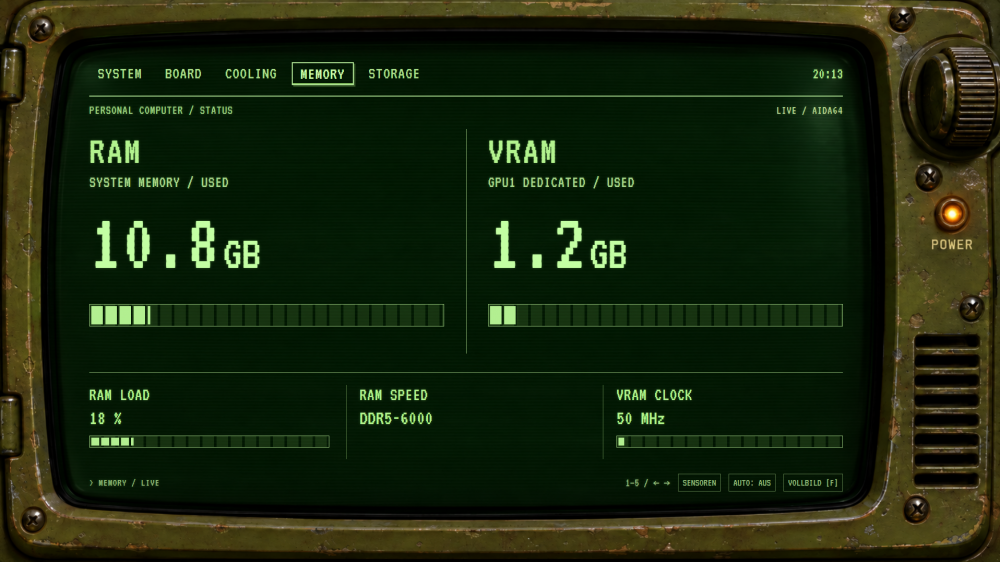
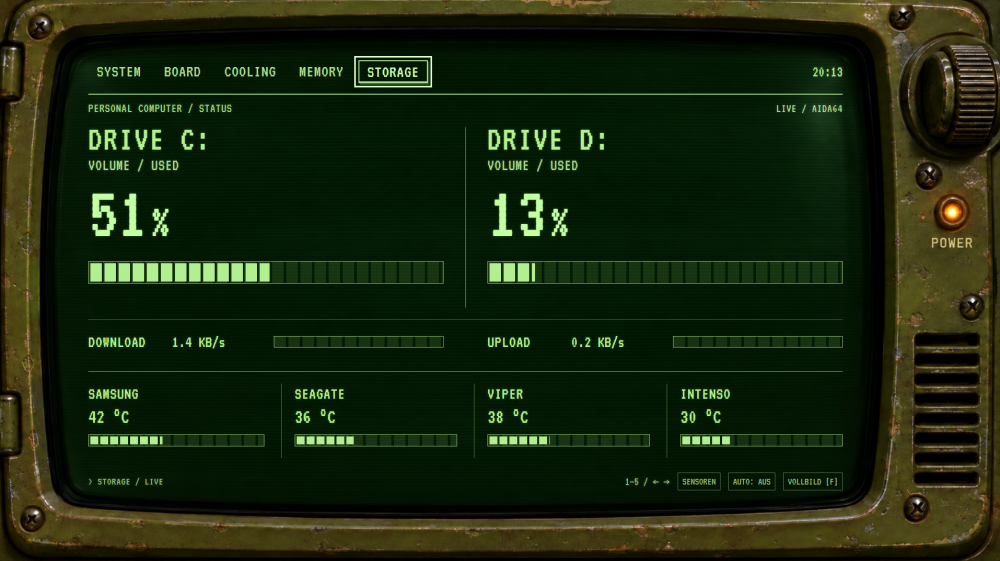
Hey, long time no see. I am not sure if it is "allowed" or "welcome", but I took a new approach and created a small Programm to extract AIDA64 Data and create a "new kind" of Sensor Panel.. If this is common and I have not seen it before, sorry. But here is what I did: I made a Fallout Pip-Boy Version of a Sensor Panel with 5 different pages to click through, or have it automatically cycled through. What do you think?
-
MAY YOU ALWAYS HAVE LUCK IN YOUR LIFE AND BE BLESSED!!! Thank you so much, this worked out perfectly fine and was easy to do!
-
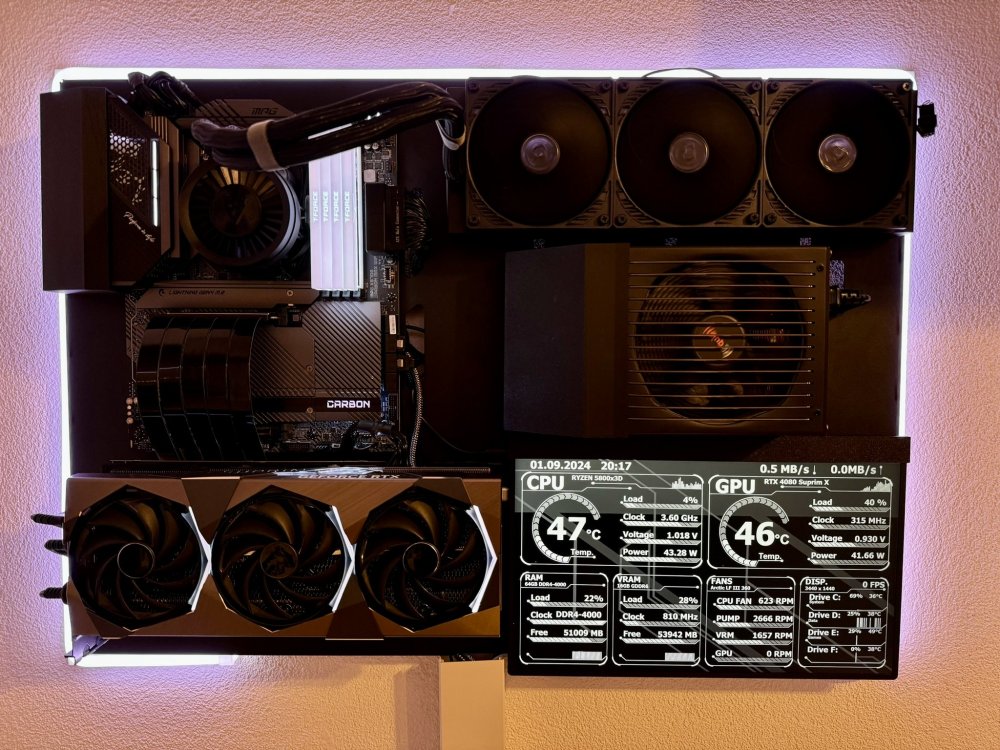
Hey, would there be any chance someone is able to reverse the colors in my sensor panel? Found it here and adopted it to my needs, but I suuuuuuuuck and picture editing and stuff.. I would love to have it with a black background and white texts and bars, etc. Simple White.sensorpanel
-
Well.. looks like it doesn't do it anymore. I just re-entered my license key and it works so far.
-
Hi, I have the Issue that my Aida64 Version forces an automatic and immidiate re start, after I close the application. Version: 6.92.6600
-
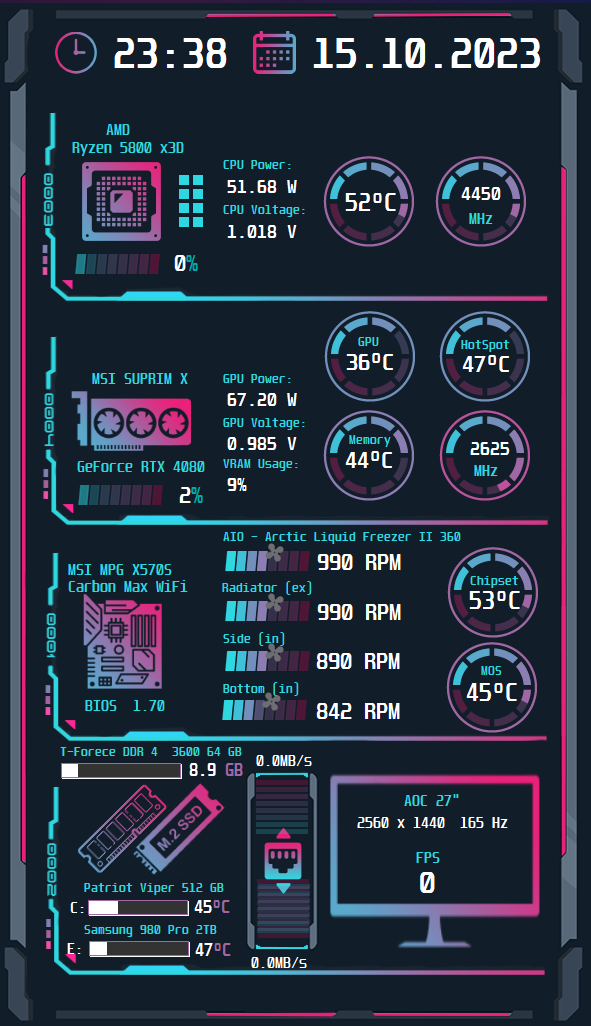
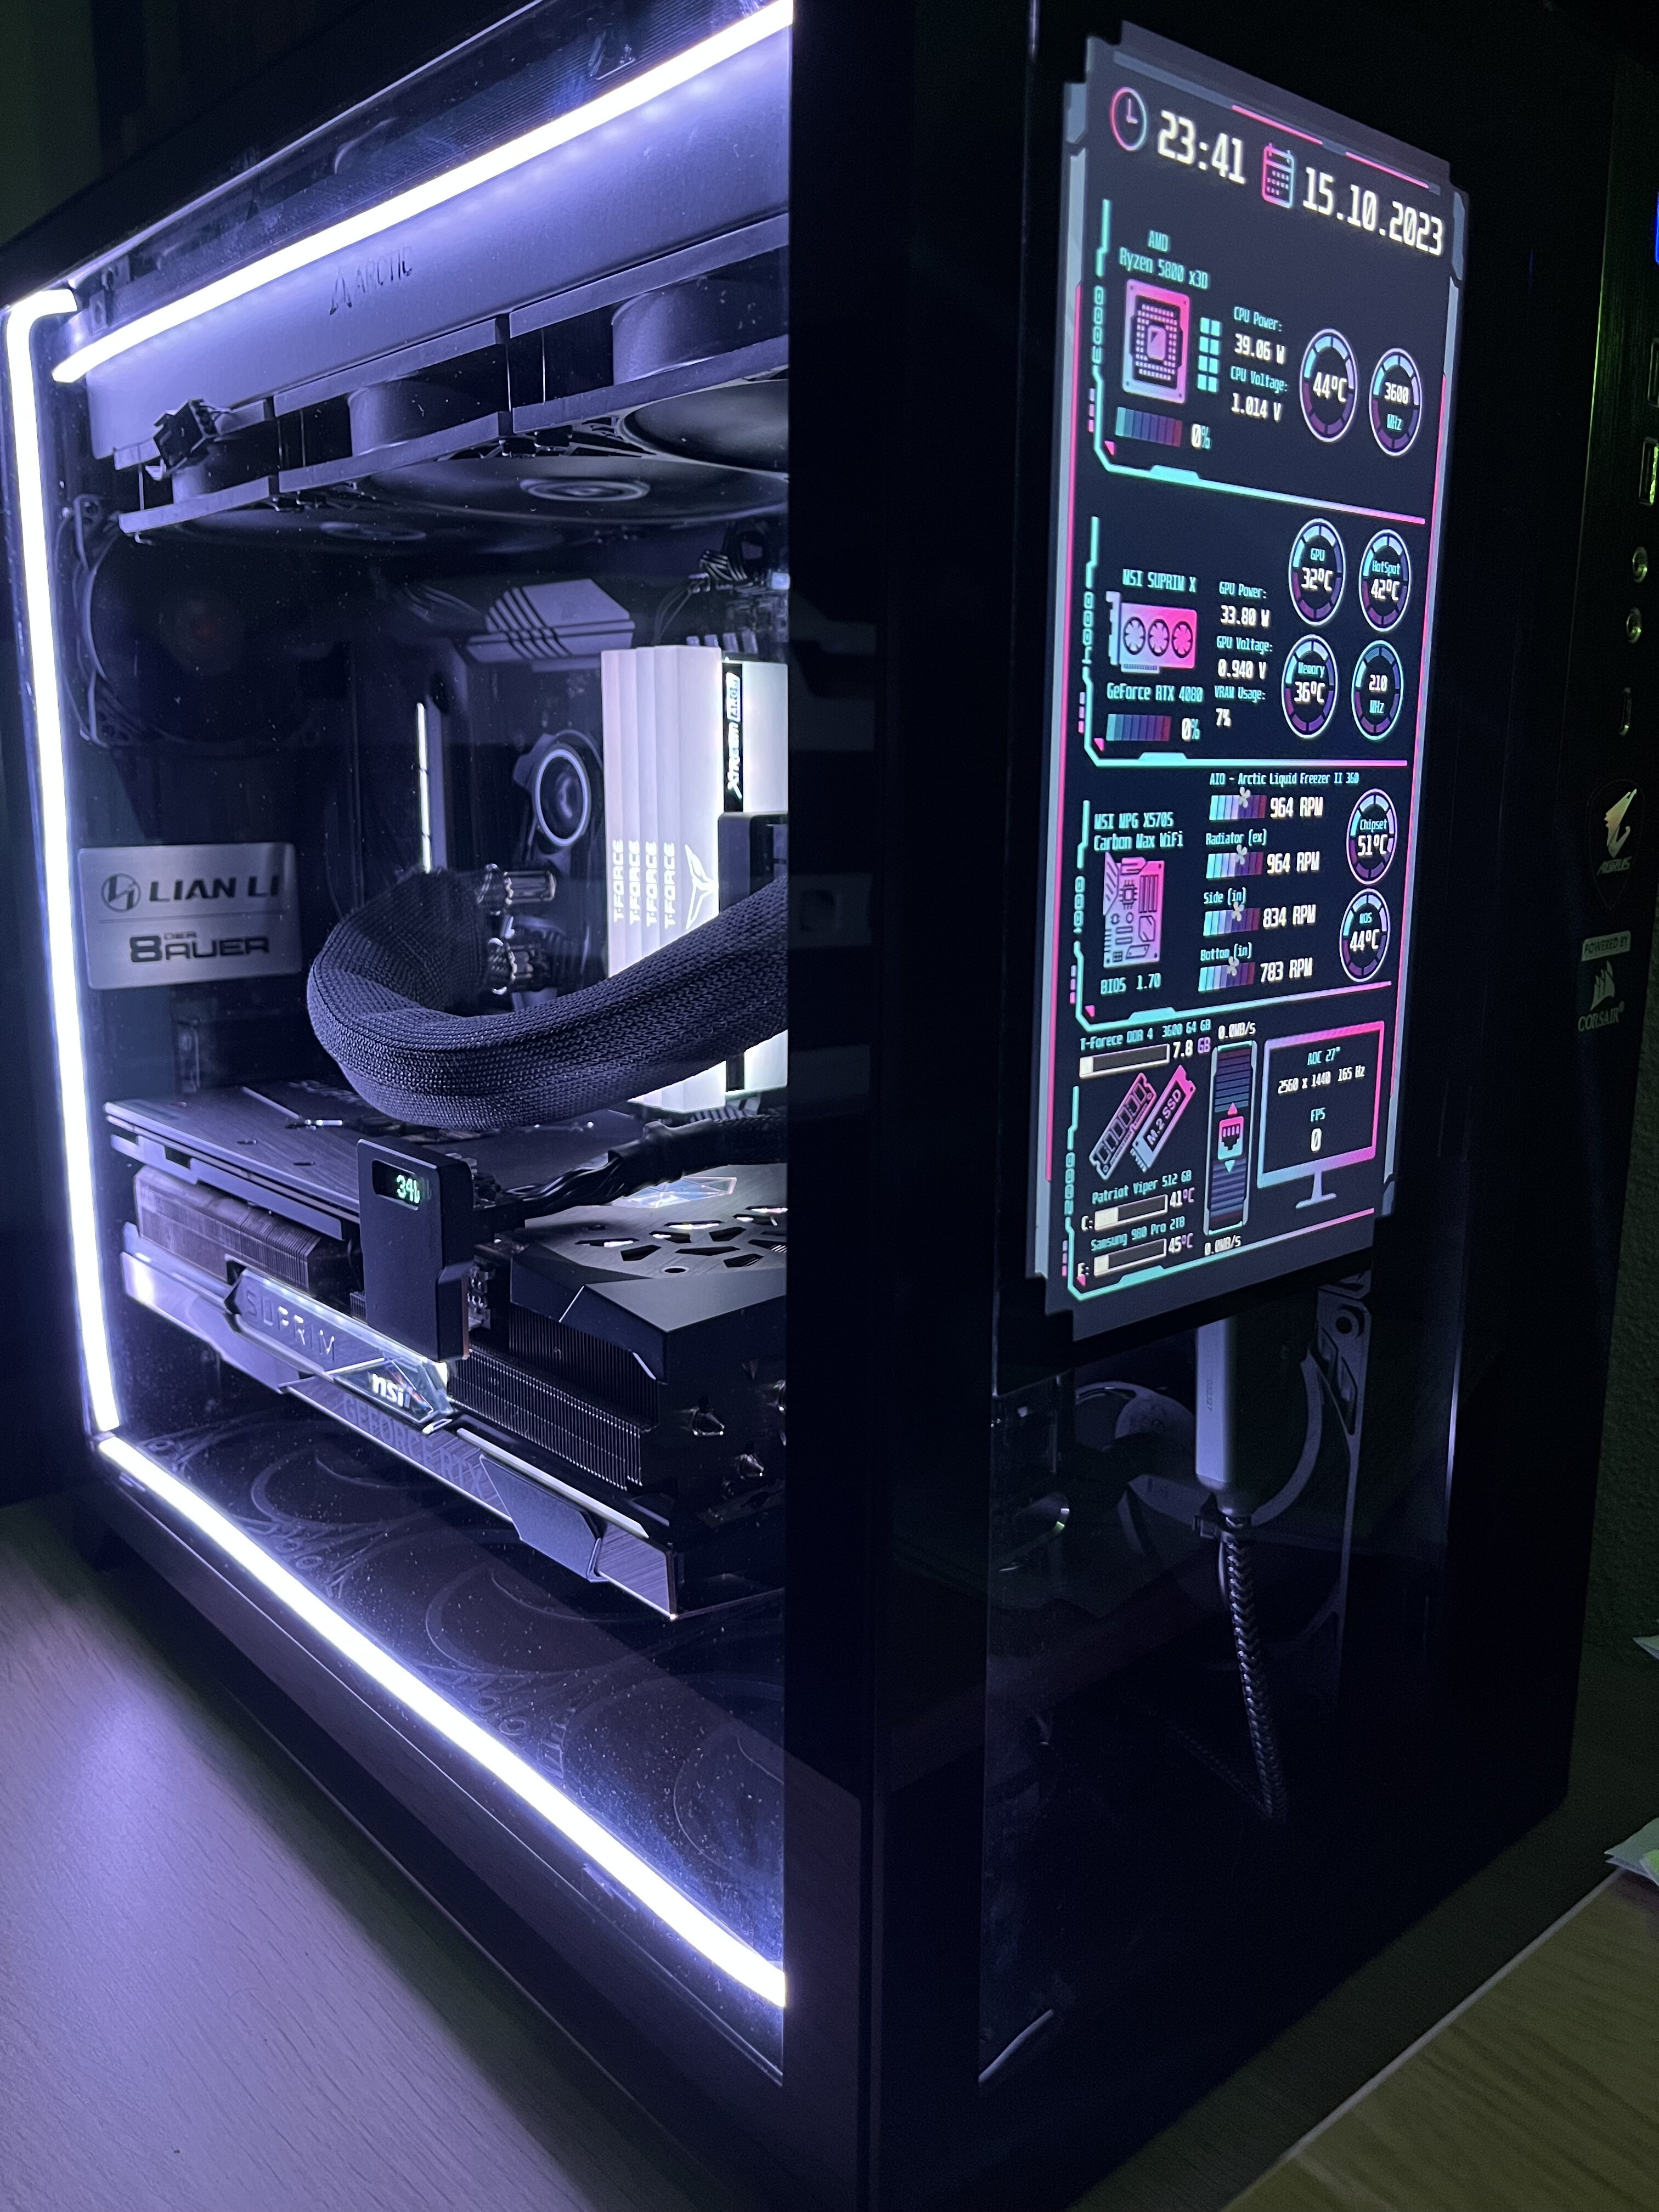
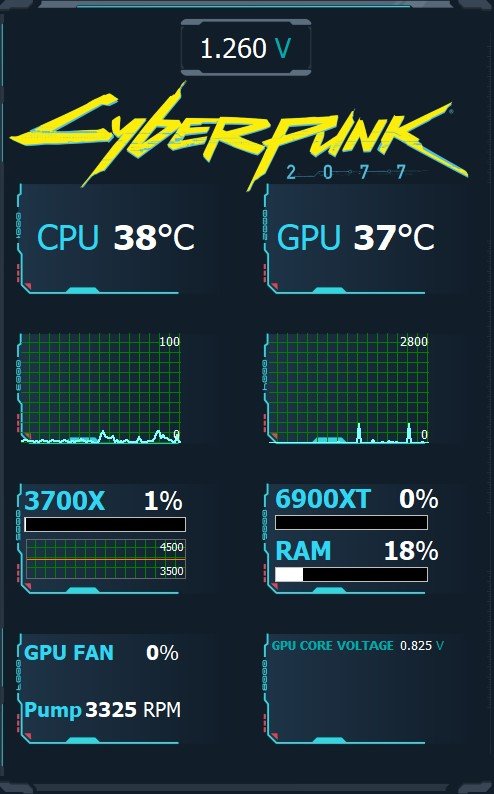
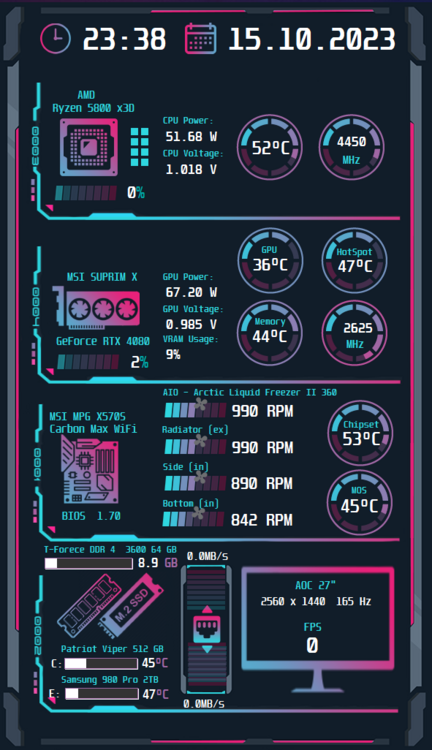
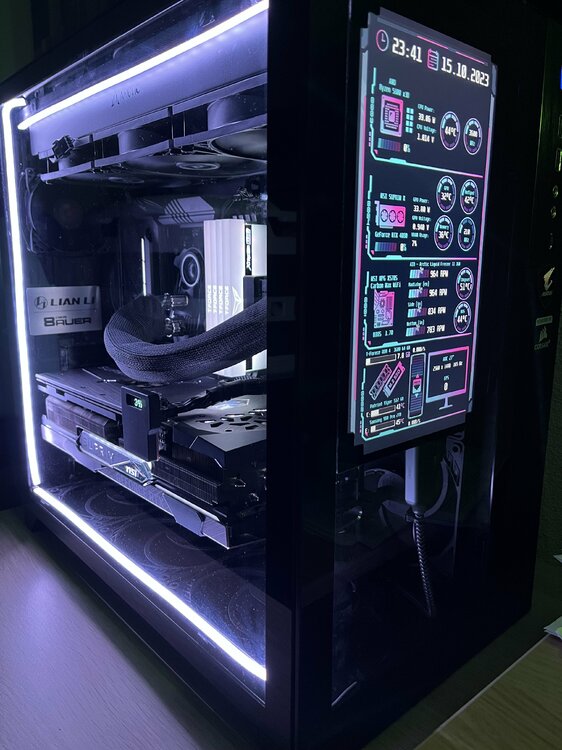
I have created my own version out of a well known Panel I've found here. 600x1024 My Sensor Panel.sensorpanel
-
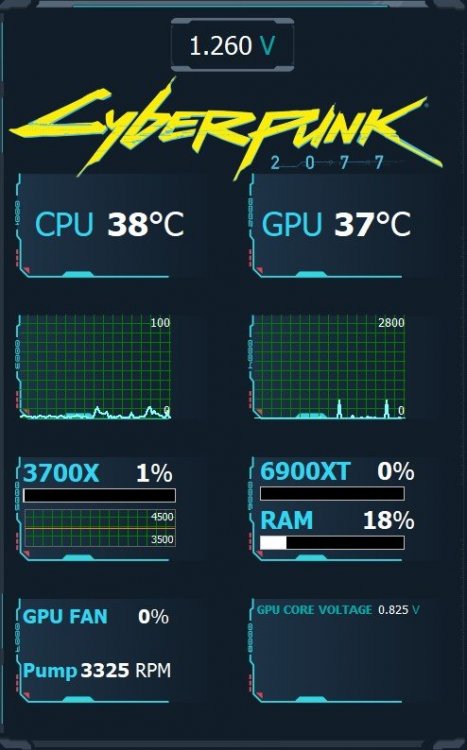
So currently I am using this one which I found here and adapted it to my "needs". I would be totally happy when the panel is just held in the Tron Theme Colours and not with an image to lose space. What I like to monitor is the following: CPU: Temps / Utilization / Clock Speed / Fan Speed as Gauge preferably / Pump Speed (Gauge) GPU: Temps / Utilization / Clock Speed / Fan Speed as Gauge preferably Ram: Utilization that MIGHT be it for the first... I don't want to be too demanding as you do it in your free time, so I'm very thankful. BW Marcel
-
Hey, sorry was busy the last days! Thank you so much!!! That looks pretty cool so far! Shall we maybe get in touch somehow to discuss a bit?
-
Hey guys, I just clicked through almost all sides in this thread and I have to say, there are some really awesome panels around! Great job! I am very new in this game of sensor panels and bought myself a 5" 800x480 Screen. Handling the Aida64 tool is not a problem at all. I would like to build a Tron Legacy theme, matching my RGB but unfortunately, I have no experience in creating graphics with any tool at all. Is there maybe someone willing to help me to realize it? I'd appreciate it with all I have. Cheers Marcel