


Cleanhead
-
Posts
35 -
Joined
-
Last visited
-
Days Won
1
Content Type
Profiles
Forums
Events
Posts posted by Cleanhead
-
-
if pausing the updates would not interfere with reporting to third party tools like RivaTunerStatisticsServer so i can use in-game overlays, that would be good enough i guess. it would really depend on would it safe ressources or not. if neither of the scenarios would achieve that, i don't really care about such an option afterall.
-
Hey there,
i would love to see an option for the sensor panel that would stop showing it when entering full screen mode (start gaming for ex) and popping back up again when leaving full screen mode automatically.
Kind Regards
-
-
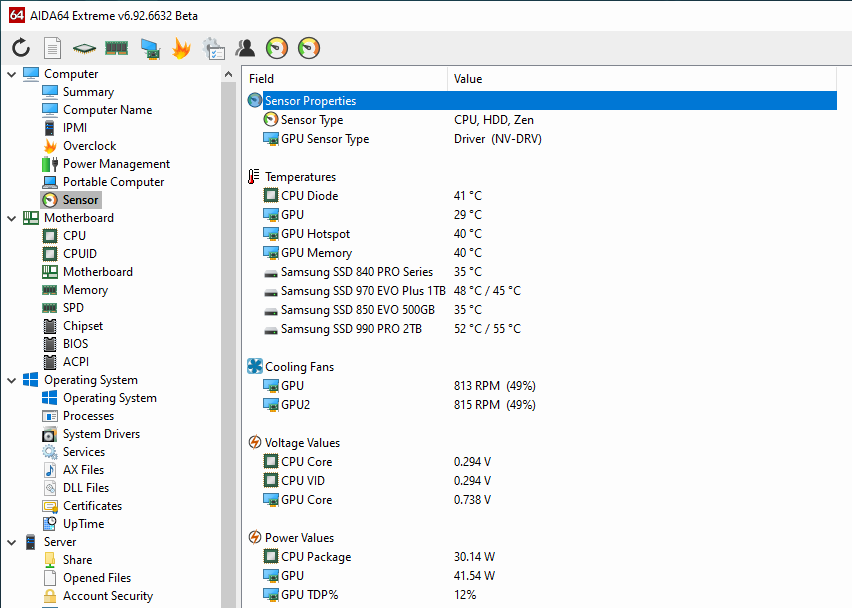
Hi @Fiery
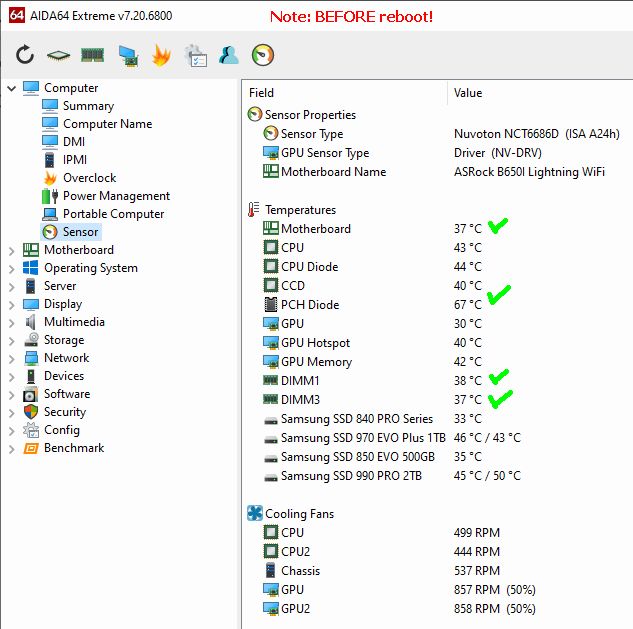
I tested v7.20.6800 Final today and at first, i thought all bugs were resolved. Unfortunately after a reboot, they turned out not to be...
On the first picture you can see that my DIMM-Temps were recognized after i closed AIDA down, updated it with the zipped files from 7.20.6800 and restarted it. I then added them to my Sensorpanel again and decided before posting here: "ah well, let's make a reboot first to make sure"
And voilá, after the reboot, the DIMM-Temps were gone again and i can't get them back to appear, no matter what i do. At this point i am like "WTF?!"
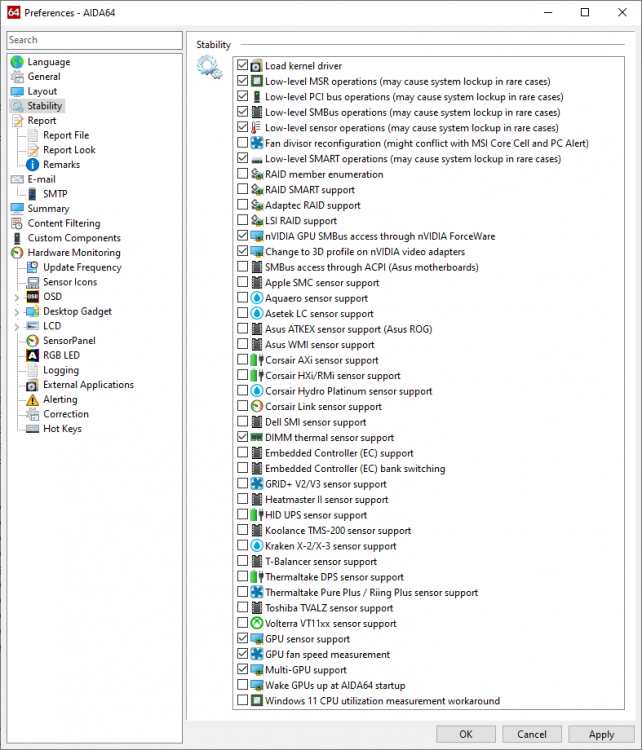
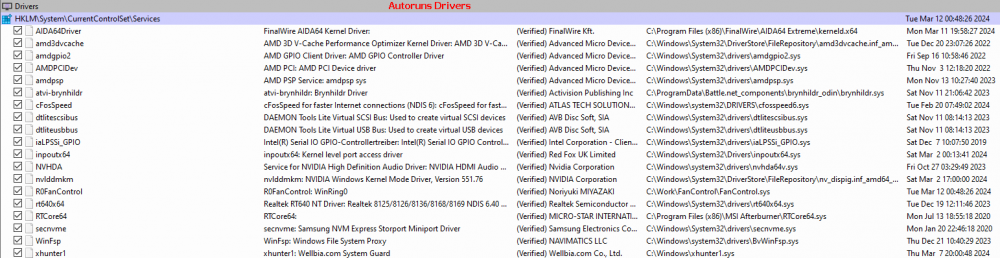
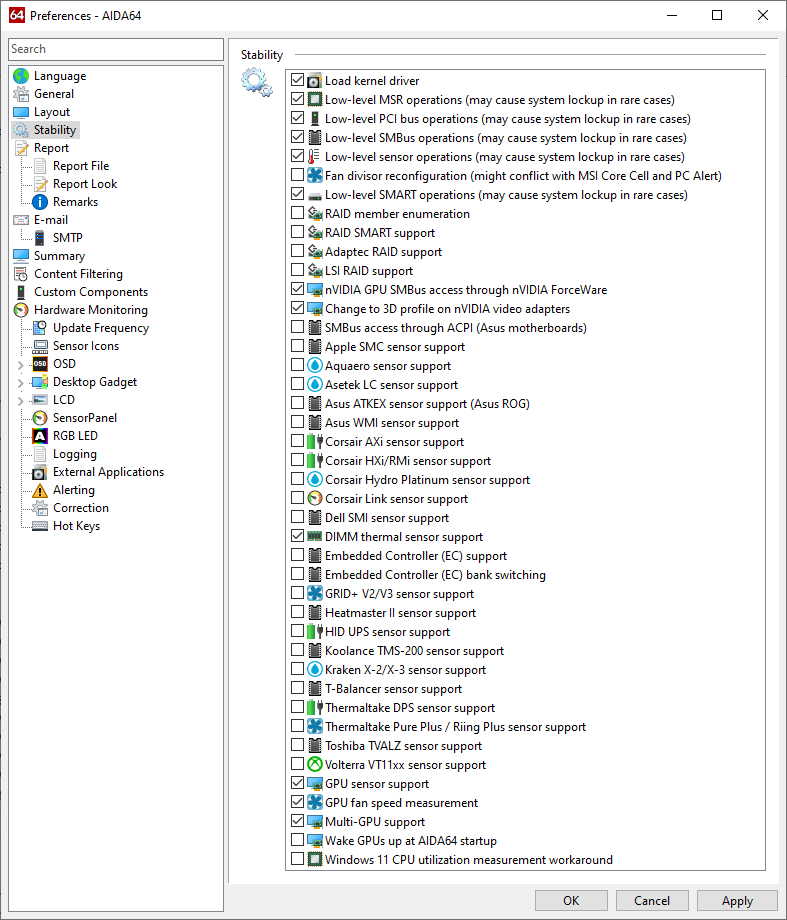
I also attached the settings i use and what drivers get loaded, maybe you can see a problem what causes this on them. In any case, since it works ONCE, there must be some other problem that exists, that only occurs after a reboot?!
Let me know if i can provide anything else to get this sucker solved once and for all!
Kind Regards
-
I don't use Windows 11 anymore but i remember this. I got it working by using this:
After disabling the kernel isolation it should not be requiered to use the workaround setting in AIDA64 anymore, so i recommend to try unchecking that setting after using the registry hack aswell. An additional reboot may be required.
Try and check if this helps.
-
Hey,
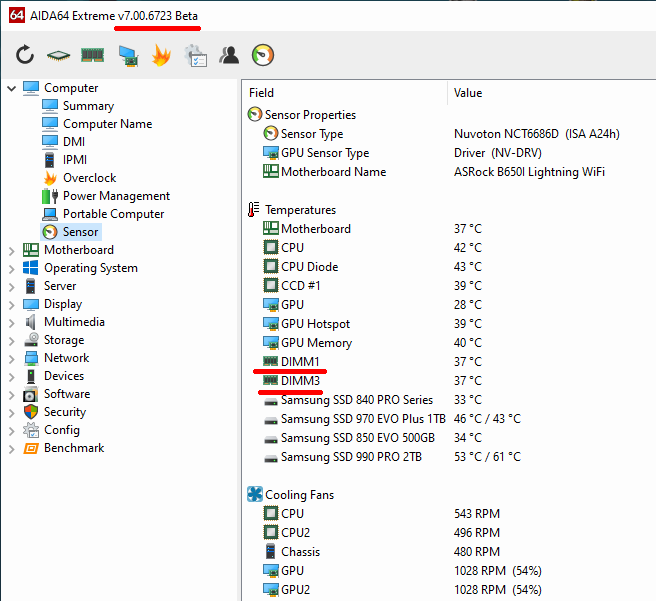
just letting @Fiery know that the latest BETA now shows my DIMM-Temps! Very nice, keep on doing good work
")
Update:
After some time the readings disappear and won't come back

Another reboot won't bring them back either. Any dump you could need that i could post here to narrow down the issue?
Edit: After 2 more days of PC usage with several reboots, OS running time about 30 hours, the readings NEVER came back once. That's weird af.
Edit 2: v7.00.6738 beta does not fix the DIMM-issue.
Edit 3: v7.00.6741 beta does also not fix the DIMM-issue.
-
Hi @Fiery
any progress on this? the latest beta 7.00.6716 unfortunately still had no core temp measurements. Why would it take so long if you don't mind me asking, especially since HWiNFO has these since over ~10 weeks already?
-
Hey there @Fiery
good job, that worked out fine. Last stop: core temp measurements. As soon as that's here, we can close this sucker thread
merry xmas for now
-
With all due respect but these "issues" rather look like program limitations than real bugs to me. This is the bug reporting forum, so i suggest to post feature requests to the appropriate forum instead to keep this clean.
Thank you
-
1 minute ago, Fiery said:
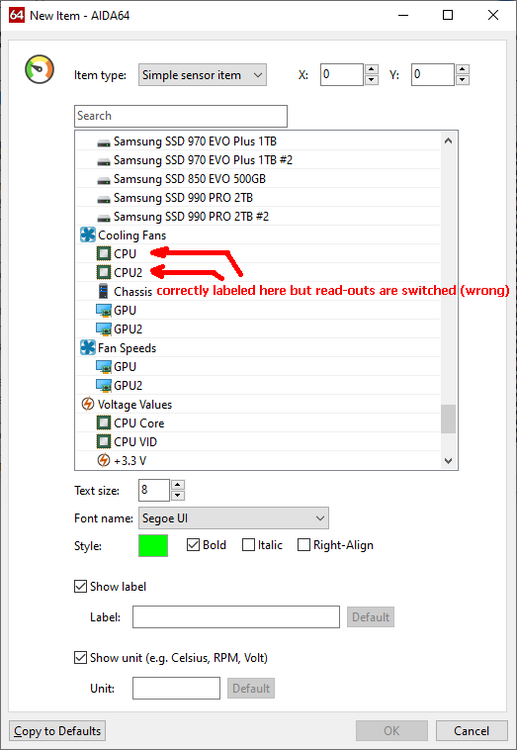
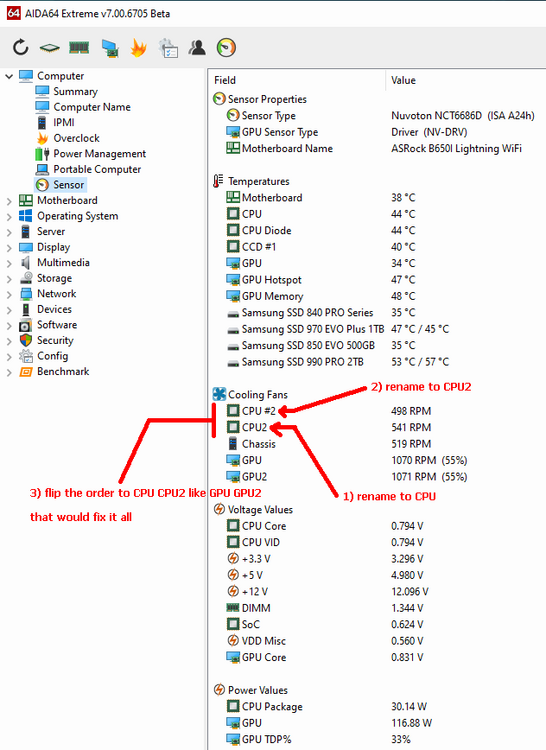
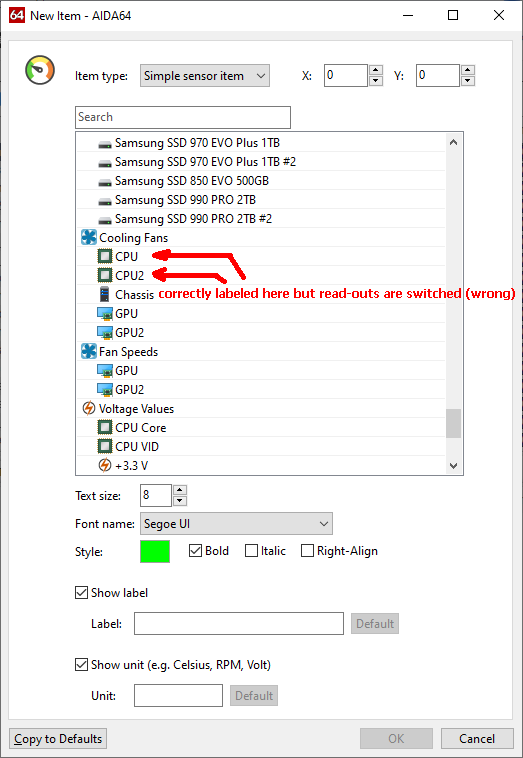
Thank you! Are you sure you're not using custom labels for the fan readings? To me it looks like you've renamed one of the fan readings to "CPU #2". AFAIK we never use such label for fans.
omg i am retarded, you are correct! but still the read-outs are switched. CPU should read out the values of CPU2 and reverse, i double checked the connectors on my mobo but i could live with that. as long as i know that it's the case it is no real issue.
-
Asking and you shall receive...
I hope it helps, thank you @Fiery
and yea the OctaCore thing is really not of any concern, i just thought i mention it as maybe you guys were in internal discussions about how to name it now/in the future etc. All good
-
@Fieryhello again
Well, we are almost there! Here are 3 screenshots with what's wrong/not yet fixed. After that, everything should be great!
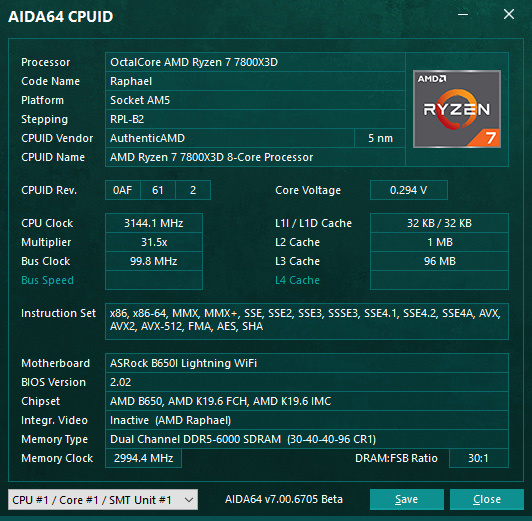
Edit: On the screenshot for CPUID it says OctalCore, i assume it's supposed to be called OctaCore?
Best Regards
-
Hi Fiery,
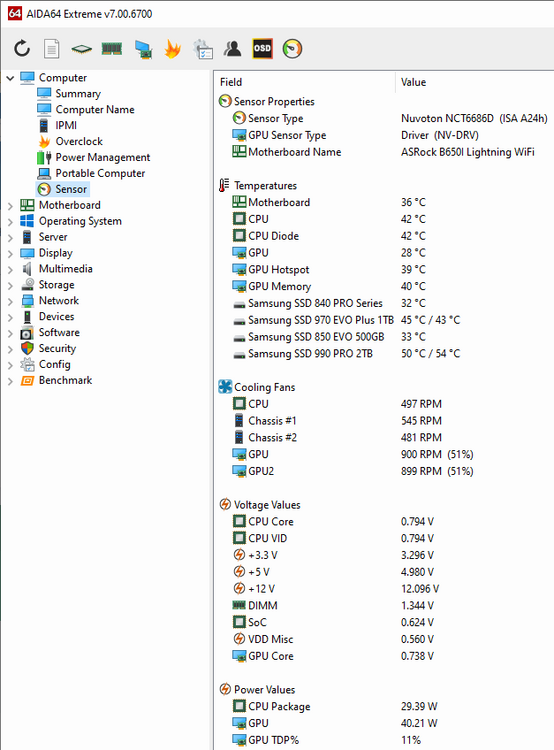
so i tested the new final v7.00.6700 today and there is still some issues/missing sensors:
- Technically Chassis #1 is labeled wrong and should be CPU #2 and CPU should be labeled CPU #1 instead, because the board according to the manual and labels on the board itself has 2x CPU-Fan-Headers and only 1 Chassis-Header so Chassis #2 would have to be labeled Chassis only. This is just cosmetics though, the reported values are unfortunately also incorrect! As it stands now: CPU reports values from Chassis #1 and reversed. Chassis #2 reports correct value
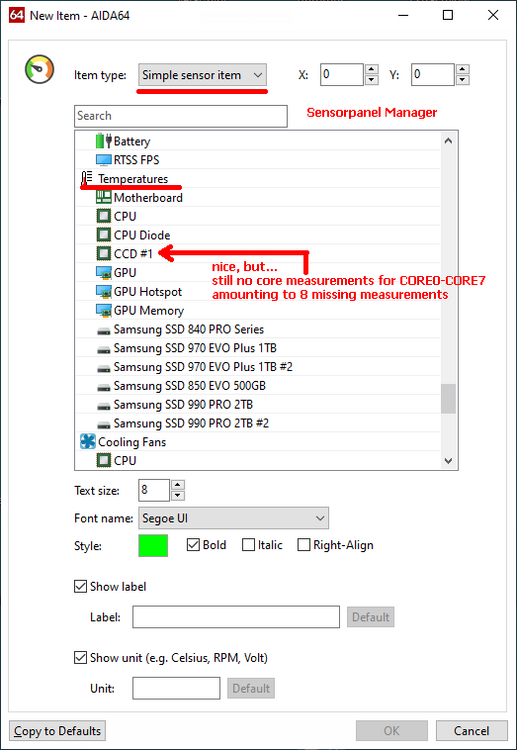
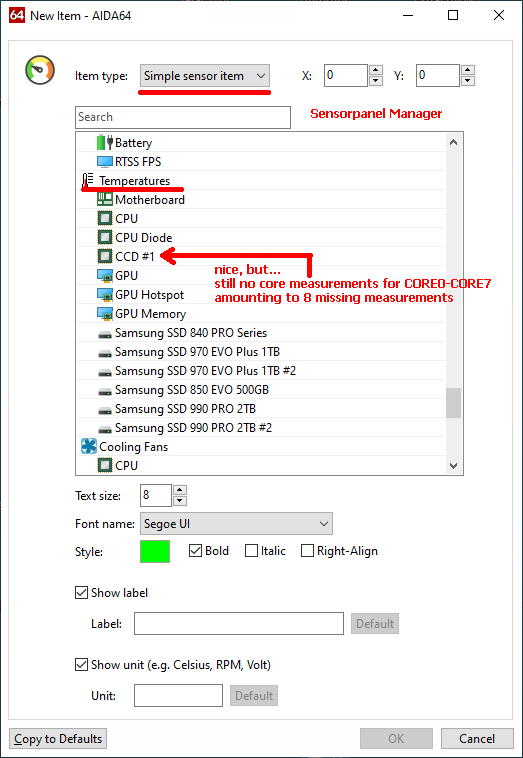
- When using the sensor panel there are still no sensors for all the core temperatures available, only for the CPU itself. The Ryzen 7 7800X3D reports the core temperatures from Core0 (CCD1) to Core7 (CCD1), 8 cores overall, and has also a sensor for the L3 Cache (CCD1). Also missing: CPU IOD Hotspot & CPU IOD Average temperature sensors, as reported in HWiNFO64 v7.66
- RAM-Temperature-Sensors are not found at all, as you can see on the attached screenshot. No big deal, just mentioning it
Looking forward to the next beta for the fixes (hopefully)
-
On 7/15/2016 at 10:11 PM, ronzino said:
aida64 5.70.3879 beta
how about upgrading to the latest version first and testing that, before filing a bug report? i am frankly surprised you even got a reaction to this, v5.70.x is extremly old by now.
-
On 11/18/2023 at 10:07 AM, frazymine said:
Hello, I downloaded the update of your application and nothing has changed, everything still freezes and only a reboot helps, what to do, help!!!!!!!!.
nevermind me, this post was old
-
Thanks for recognizing and the promised fix!
I'll report back in case something is still missing/not working when the update arrives.
-
Hi Fiery,
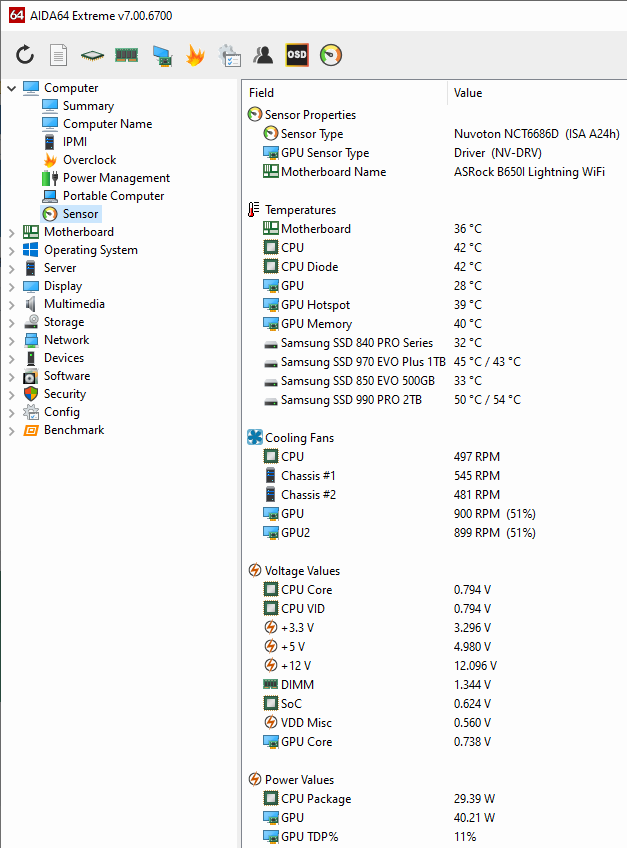
I just build a new rig with the following motherboard: Klick
Name: B650I Lightning WiFi
Bios-Version: v1.28
CPU: AMD Ryzen 7 7800X3D
RAM: 2x G.Skill F5-6000J3040G32G (SKU F5-6000J3040G32GX2-TZ5K) /w Temp-Sensors
OS: Windows 10 Pro German 22H2 (19045.3693)As you can see on the attached screenshot, those are all the sensors that are available. Here is a list of some important sensors that are missing, which are available in HWiNFO64 v7.66:
- RAM-Temperatures
- all CPU temperature sensors except CPU Diode
- all PWM/motherboard fan sensors incl. fan speeds (CPU1, CPU2, Chassis1)
- some motherboard specific temperature sensors like T15, T16
- total CPU Utility
- something i may have missedIf there is anything i can provide you with so in the next beta/final update there will be support for this board, please let me know.
Kind regards
Cleanhead
-
Hello Fiery,
well now it get's really weird...
1) I tried the suggestion from you (main/tools) -> works
2) After i closed all AiDA64 windows and tried tray/tools -> works
3) Reboot
4) Tried tray/tools -> not working
5) Tried main/tools -> not working aswellnow what? lol
btw. the out of visible desktop area i can rule out because when the stability test is in fact opened, it still shows the AiDA64 taskbar icon. So does every other tool that gets started and they start every time with no issues. When it's not working/loading, there's no taskbar icon either so unfortunately it seems to be not such an easy diagnosis.
Setup: I have 2 monitors (DP) connected, 1 on my GPU (NVidia GTX 1070 Ti), 1 on my iGPU (Intel UHD 630) and a TV via HDMI also the iGPU - in case that helps
EDIT
Ok i found the problem:
i used to start aida64.exe from a batch file via https://www.nirsoft.net/utils/nircmd.html and the -hidden flag, which seems to f*ck smth up with the process or whatever. I changed the batch file to start /D aida64.exe and after a reboot the system stability test was started fine right away from the tray menu. Since i doubt that anyone else uses this kind of method i would assume it's safe to close this "bug" as resolved
-
Hello,
when trying to start the System Stabilty Test from tray menu- > tools - nothing happens
sorry for reporting this so late, it was already not working since (at least) the BETA before v6.88.6441
Edit: All other tools start just fine, ex AIDA64 CPUID etc.
OS: Win 11 Pro for Workstations, 22H2, Build 22621.1992 - Kernel Protection disabled (for accurate CPU/Kernel Mhz measurements) -
ok thanks, i was afraid that's the case, aka not fixable via software
-
Hi,
v5.50.3600 final
i recently upgraded my server with some new hardware. i installed a pwm splitter-cable on my Asus CPU OPT fan sensor and put 2 pwm fans on it, same brand, same type. now on frequent intervals, the readings report 0 RPM which cause my alerts to report that via email. i set that up beforehand when only 1 fan was connected to that port to be reported below 100 rpm. needless to say, when only 1 fan was connected, this issue never occured. i also recognized that sometimes the CPU OPT sensor even disapears from the sensors tab completly for some seconds.
can this even be be fixed or is the pwm splitter causing this and i gotta live with it?
if more info is needed i can provide.
ps. i forgot to mention that in fact the fans never get shut down to 0 rpm or even close to that. they spin all the time with no issues.
-
i am not sure if this is related but, the version posted on the screenshot here is kinda old: 4.30.2900
could it be that the newest beta 4.50.3029 fixes this?
-
alright, you may close this thread then :-)
-
Thanks for the update!
It seems that AIDA has a problem determining the status of the firewall.
Screenshot:

Even though it is activated the status ? is shown. I guess that's not intended...


Missing alot of motherboard specific sensor info on recent ASRock AM5-Motherboard (ASRock B650I Lightning WiFi)
in Bug reports
Posted
@Fiery did it help? it was not yet fixed in the v7.20.6811 beta build. will it take longer and if so can you give me an eta?