

VeilSide
-
Posts
52 -
Joined
-
Last visited
-
Days Won
10
Content Type
Profiles
Forums
Events
Posts posted by VeilSide
-
-
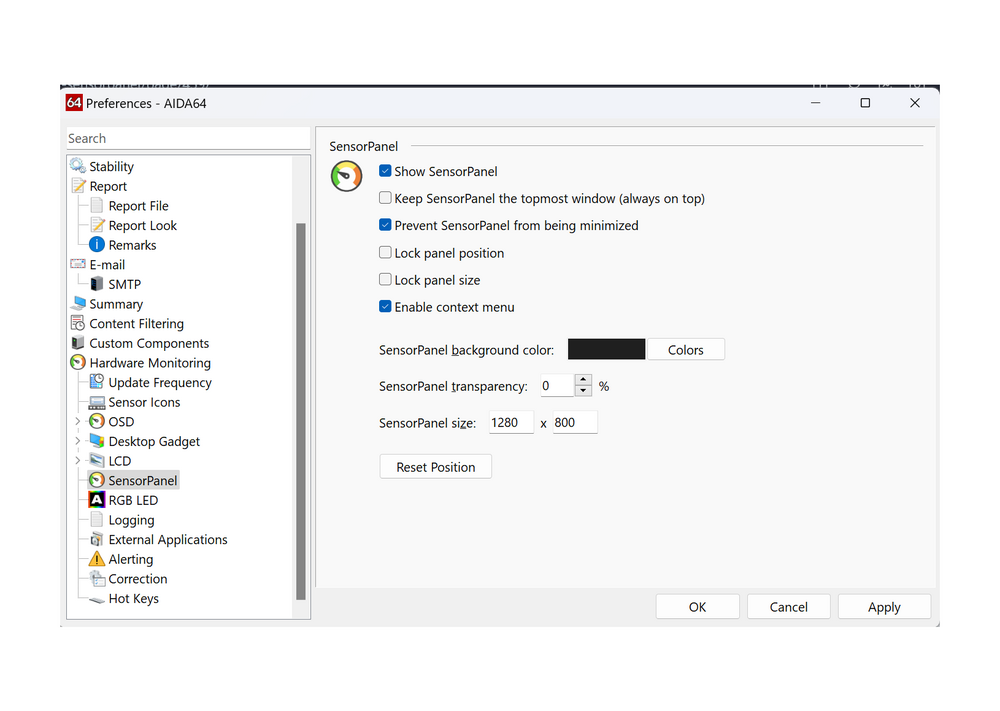
As title suggests, this feature is very much needed as there is still no fix for DPI scaling issues in SensorPanel.
Here I have my 1920x1080 sensorpanel which I use on LG C9 as monitor with 225% scaling.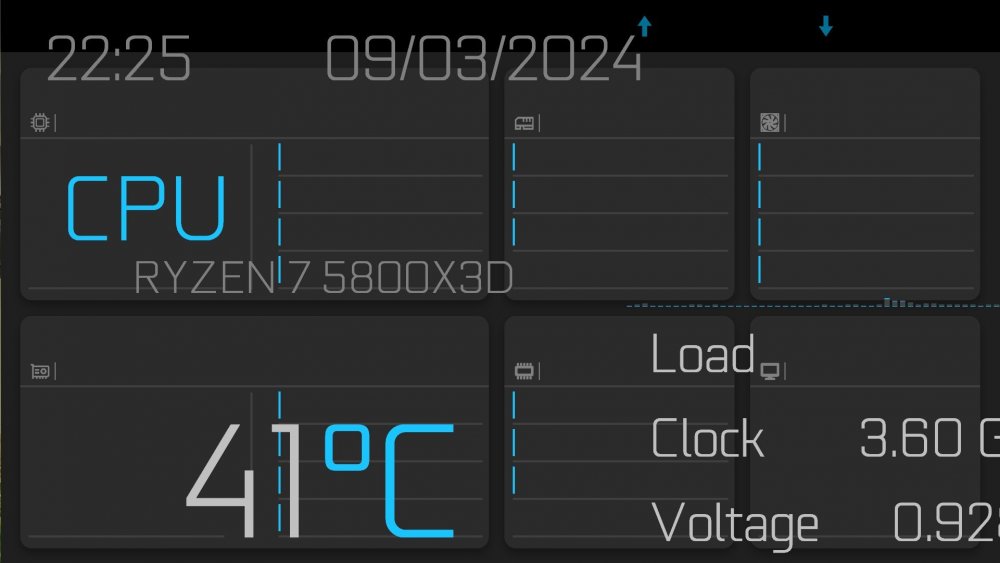
If I use 100% scaling and reload Aida64, everything shows correctly. Trouble is, everything is too tiny to see so I cannot use it at 100% scaling.

-
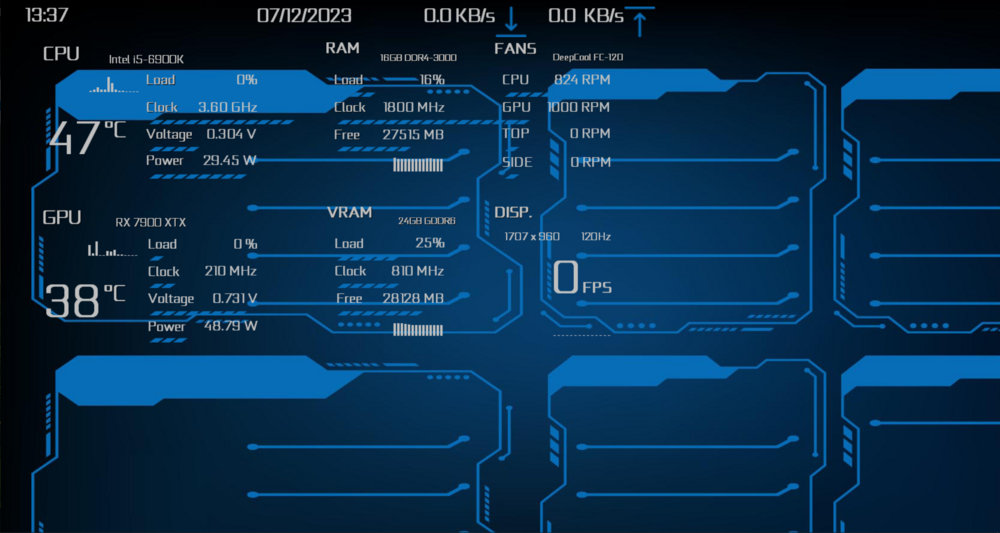
19 hours ago, FatalizXz said:
I made a touchpad for myself, the authors are on this site. I don't remember what their nicknames are (sorry guys). There are some mistakes, I will fix them this week
The screen resolution is 1280x800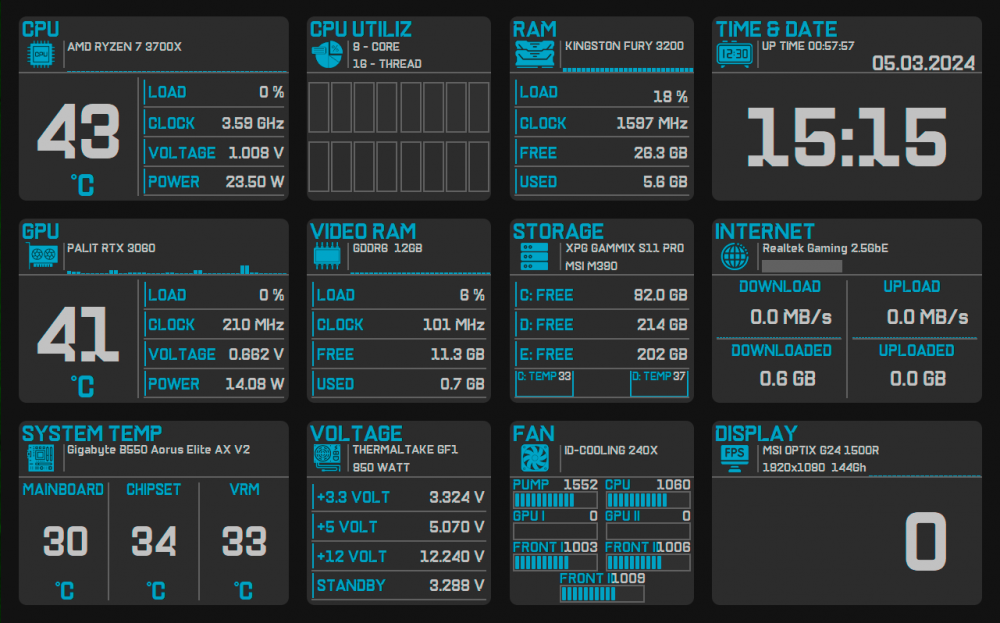
Very nice design. It's amazing how much info you were able to cram into my minimalistic template.
-
 1
1
-
-
On 1/14/2024 at 9:41 PM, ValhallasAshes said:
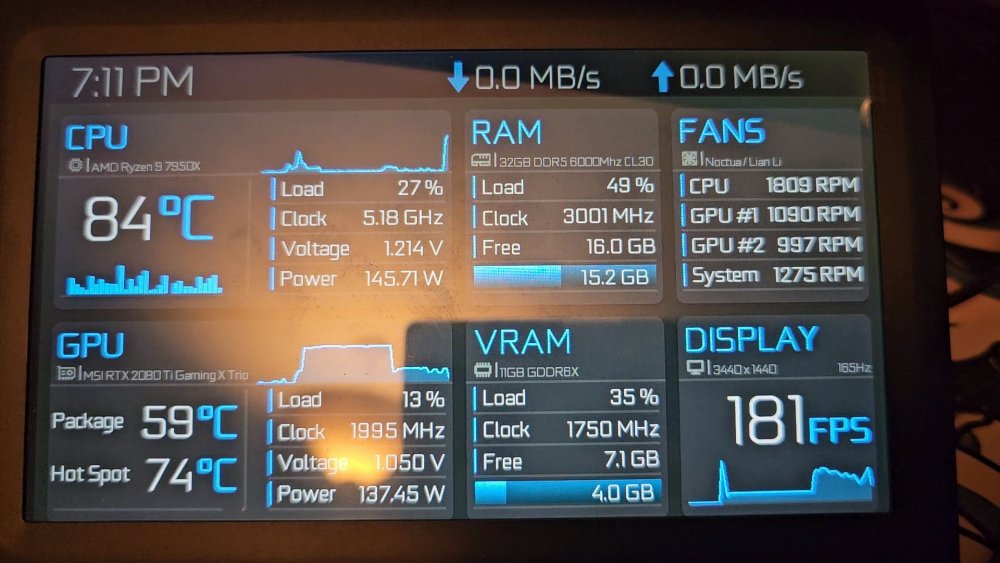
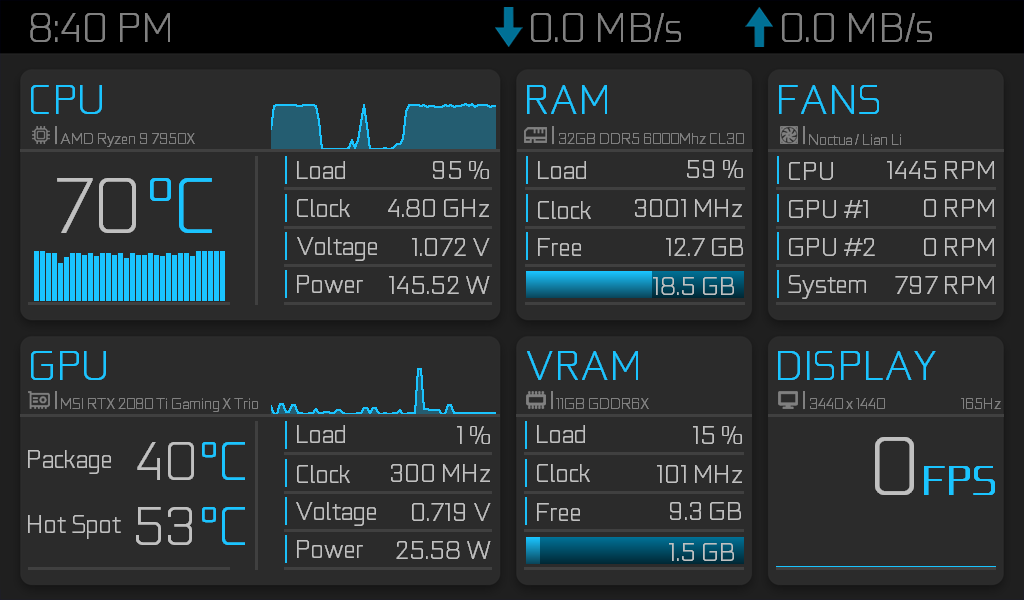
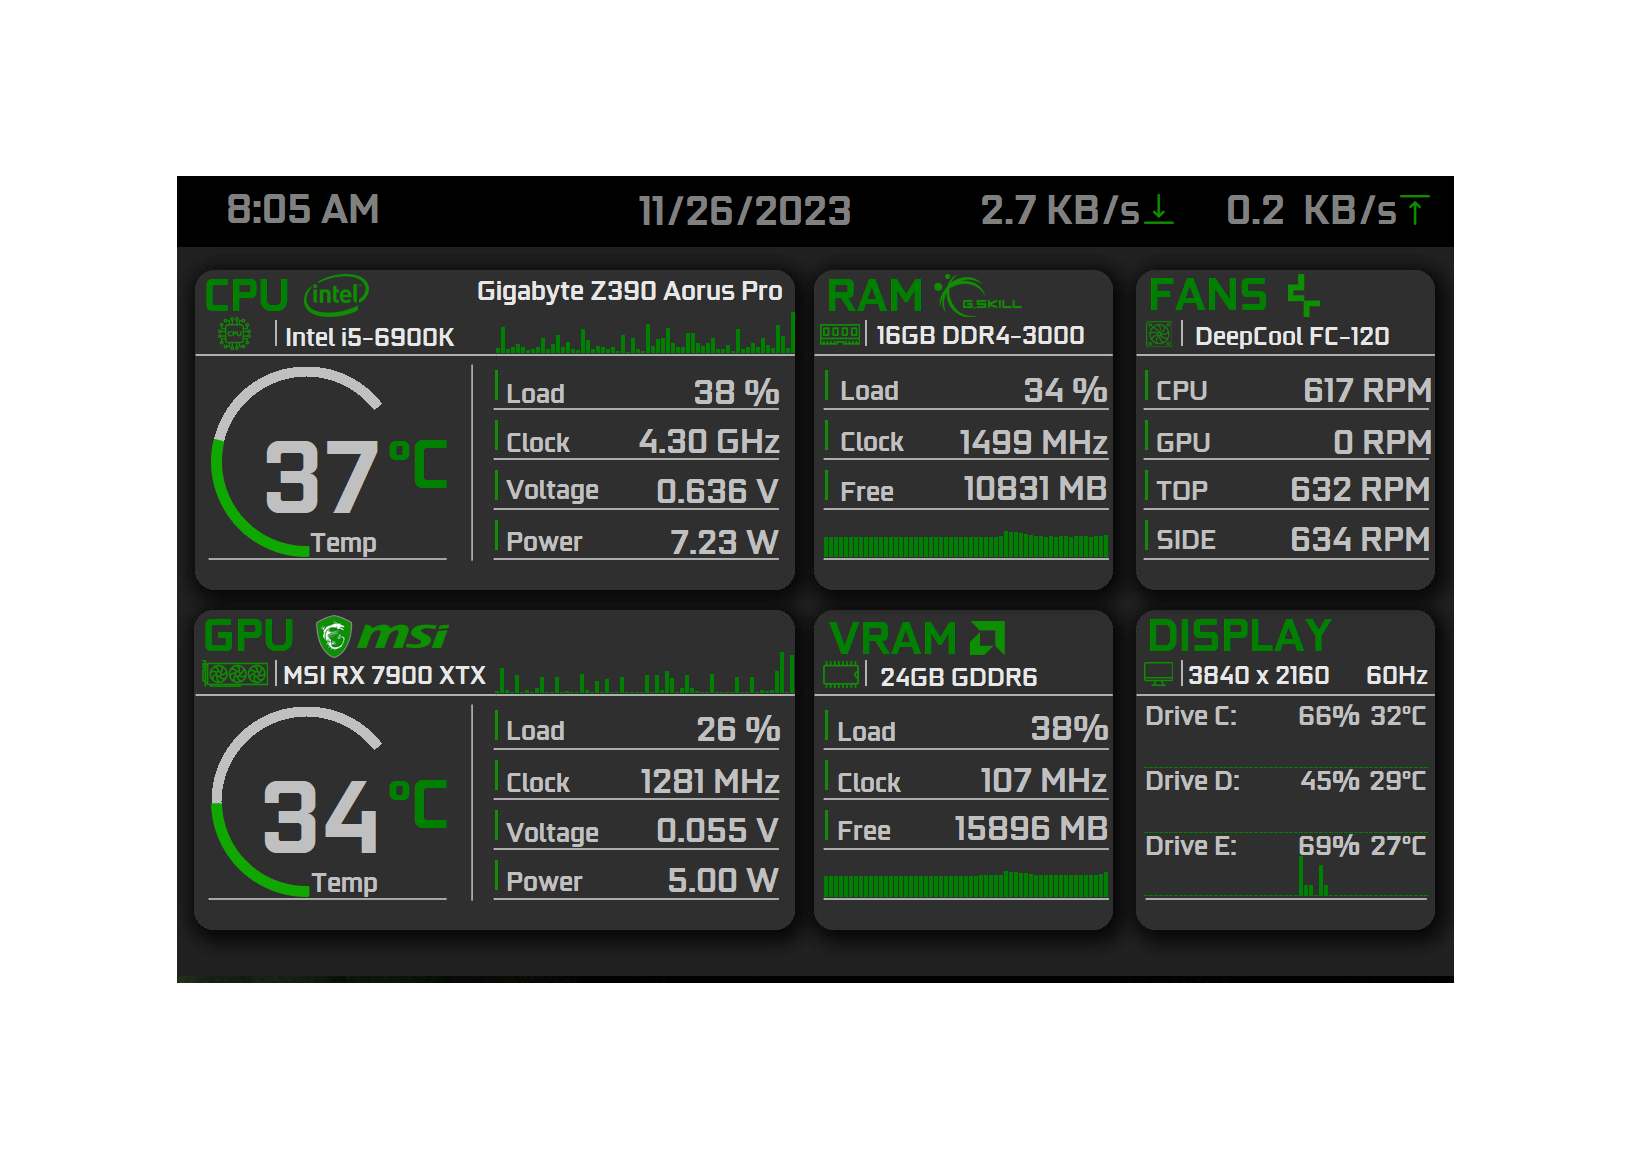
I hope you don't mind. I really liked your sensor panel, but needed it in a 1024x600 format to work with my G.Skill WigiDash. I used the 1920x1080 version as my baseline and I had to manually edit and touch up each of the elements to make it work with the smaller screen.
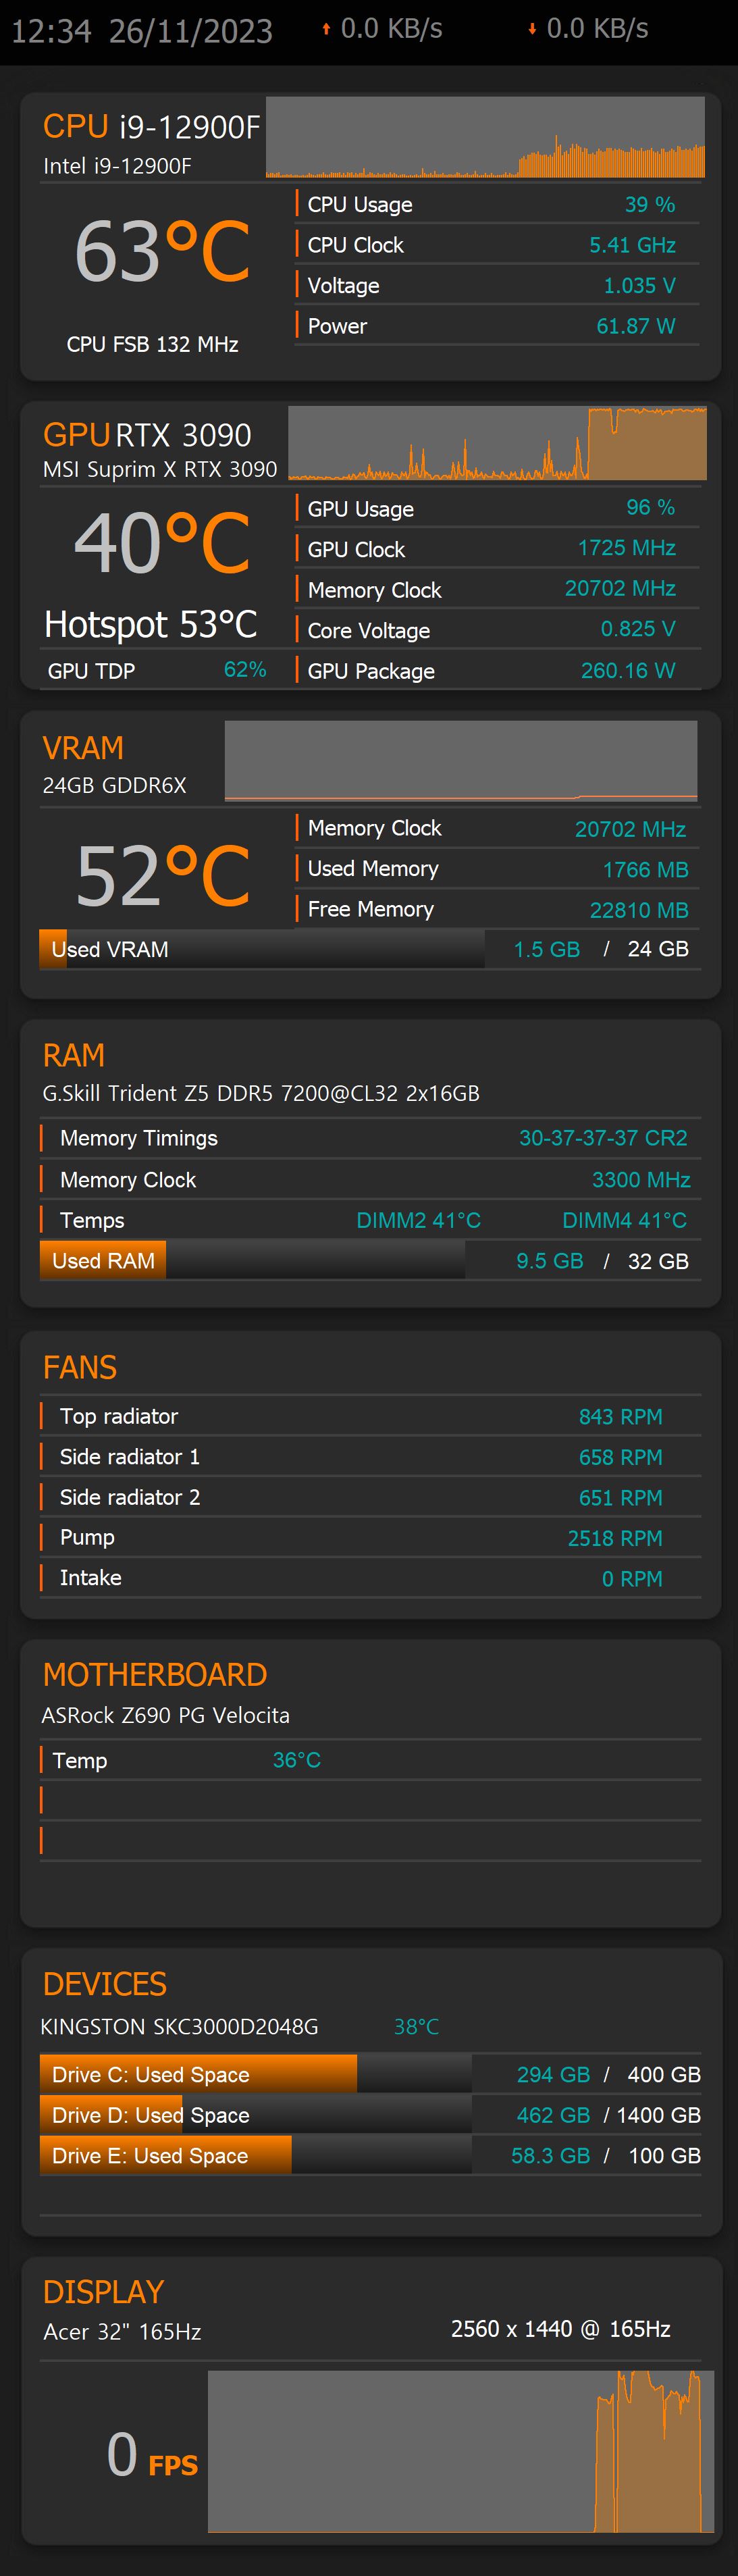
I did make a few alterations to better suit my needs though. Such as I didn't really need to have the min/max icons and info for the CPU and GPU. So in the CPU section, I replaced those with individual skinny bars for each of the logical threads on my CPU. So on the top right, I kept the area graph for the overall CPU usage, but under the CPU temp, I have usage bars for all of the CPU cores/threads.
And in the GPU section, I traded the min/max temp identifiers for a GPU Hotspot reading. I had a recent issue with my GPU where the package reading kept saying the GPU was operating at safe temps, but my GPU would constantly over rev at full pelt. It wasn't until I checked the Hotspot temp that I found the GPU had a Hotspot temperature delta of well over 40 degrees hotter than the package temp. For reference, the Hotspot should be less than half that delta. A massive difference that it never should've been, pushing the GPU to well over 100 degrees under full load.
That information, had I known it earlier, would've prompted me to replace the thermal paste years ago, but due to my only knowing about the standard temp reading, I relied on that reading to assume that the card was operating normally even though my gut told me something was wrong. Even MSI when I called them about it, told me it was probably just a defective sensor. Turned out the opposite was true. The card knew exactly what was wrong. Afterburner just never showed that sensor's reading to me. Replacing the thermal paste fixed that issue and the card now runs the way you would expect it to. Thankfully due to my paranoia during the issue, as a precaution, I ran the GPU for years undervolted to keep the fans from over revving. That must've been just enough to keep the card from cooking itself to death until I could find the cause of the problem.
As a result of that experience, I now consider the hotspot temp to be a critical piece of information. So I replaced your min/max values with that reading instead.

I saw someone else asking for the 1024x600 version of your minimalist sensor panel, but for the life me, I can't find it again. So I thought I would post it here in case anyone else wanted it. I hope you don't mind.
As mentioned, I originally needed this for my G.Skill WigiDash sensor panel.
Before anyone asks, no I don't have two GPUs. My GPU simply has two separate fan controllers. Hence the two GPU fan readings.
I'm going to upload two different files. One is the standard 1024x600 version of the sensor panel and you will be able to know which one it is by it having the .sensorpanel extension at the end of it's file name.
The other file I'm going to upload is a version specifically for the G.Skill WigiDash and you will be able to know which one it is by it having the extension .gslcd at the end of it's file name.
While yes, technically both files can be imported and will work for either the standard sensor panel function or Wigidash (LCD section of Aida64), the reason I've done two versions is due to a technical discrepancy between what G.Skill marketed the screen's resolution to be and what Aida64 detects the screen's resolution to be. G.Skill originally advertised the WigiDash to have a resolution of 1024x600, but in practice, Aida64 recognizes the screen as having a resolution of only 1016x592. A discrepancy that does affect the alignment of the sensor panel on the WigiDash screen. So the .gslcd WigiDash version of the file includes offsets to compensate for the resolution mismatch to fix the panel's alignment. So make sure to download the version that's appropriate to your use case.
Standard version:
Blue_Minimalist_1024x600_Rework.sensorpanel 181.58 kB · 18 downloads
WigiDash version:
Blue_Minimalist_1024x600_Rework.gslcd 181.55 kB · 9 downloads
GeForce Font:
geforce_light.otf 118.92 kB · 10 downloads
Thanks again to VeilSide for creating this incredible sensor panel. It's exactly the style I was wanting and with a few tweaks, it has all the information I wanted. Simple, clean, informative, looks great while being organized and easy to read. And completely unbranded. I love it. Great job Veilside, and I hope you don't mind me sharing a modified version of it.
EDIT: Found a couple text misalignments. Fixed them and updated the files in this post. Also posted the GeForce Font file. Forgot to include that in the original post.
Hey! Very nice addition and thank you for using my sensorpanel.
-
1
-
-
On 12/7/2023 at 3:20 PM, 5150 said:
I really dont know why AIDA does this.. ive seen videos for possible fixes for this. When this happened to me i just moved everything to where it belongs. these are the settings i have on mine, other than the resolution being different. but it seems like it kept the font sizes for 1280x800 also make sure you have geforce font installed before you use open the panel
My settings are all correct and I have the necessary fonts installed. I'm afraid It looks like text would require manual resizing and positioning for the 1920 x 1080 version. I've experienced same issue when working on my minimalistic SensorPanel. AIDA64 does a really poor job when it comes to text scaling.
-
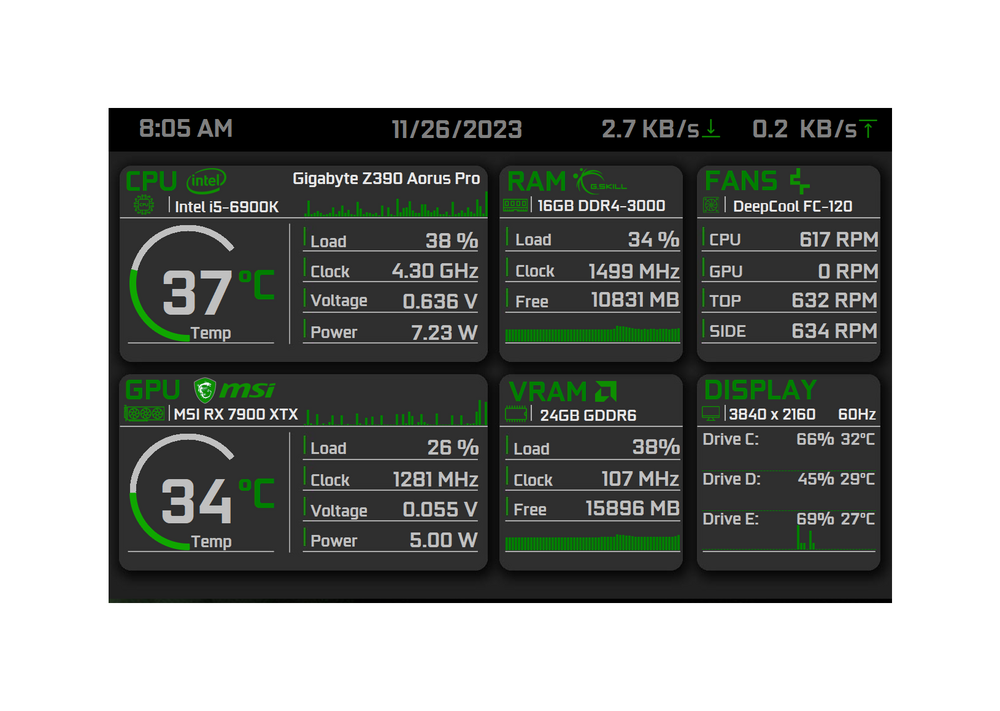
9 hours ago, 5150 said:
1920x1080 as requested. make sure you change the gauges minimum and maximum according to the specs of your PC


CyberBlueV1-1080p.sensorpanel 446.27 kB · 3 downloads CyberBlueV2-1080p.sensorpanel 453.16 kB · 2 downloads GeForce.zip 276.51 kB · 2 downloads
Outstanding work! Thank you very much. Only one problem is that text is all out of place when I load it up
-
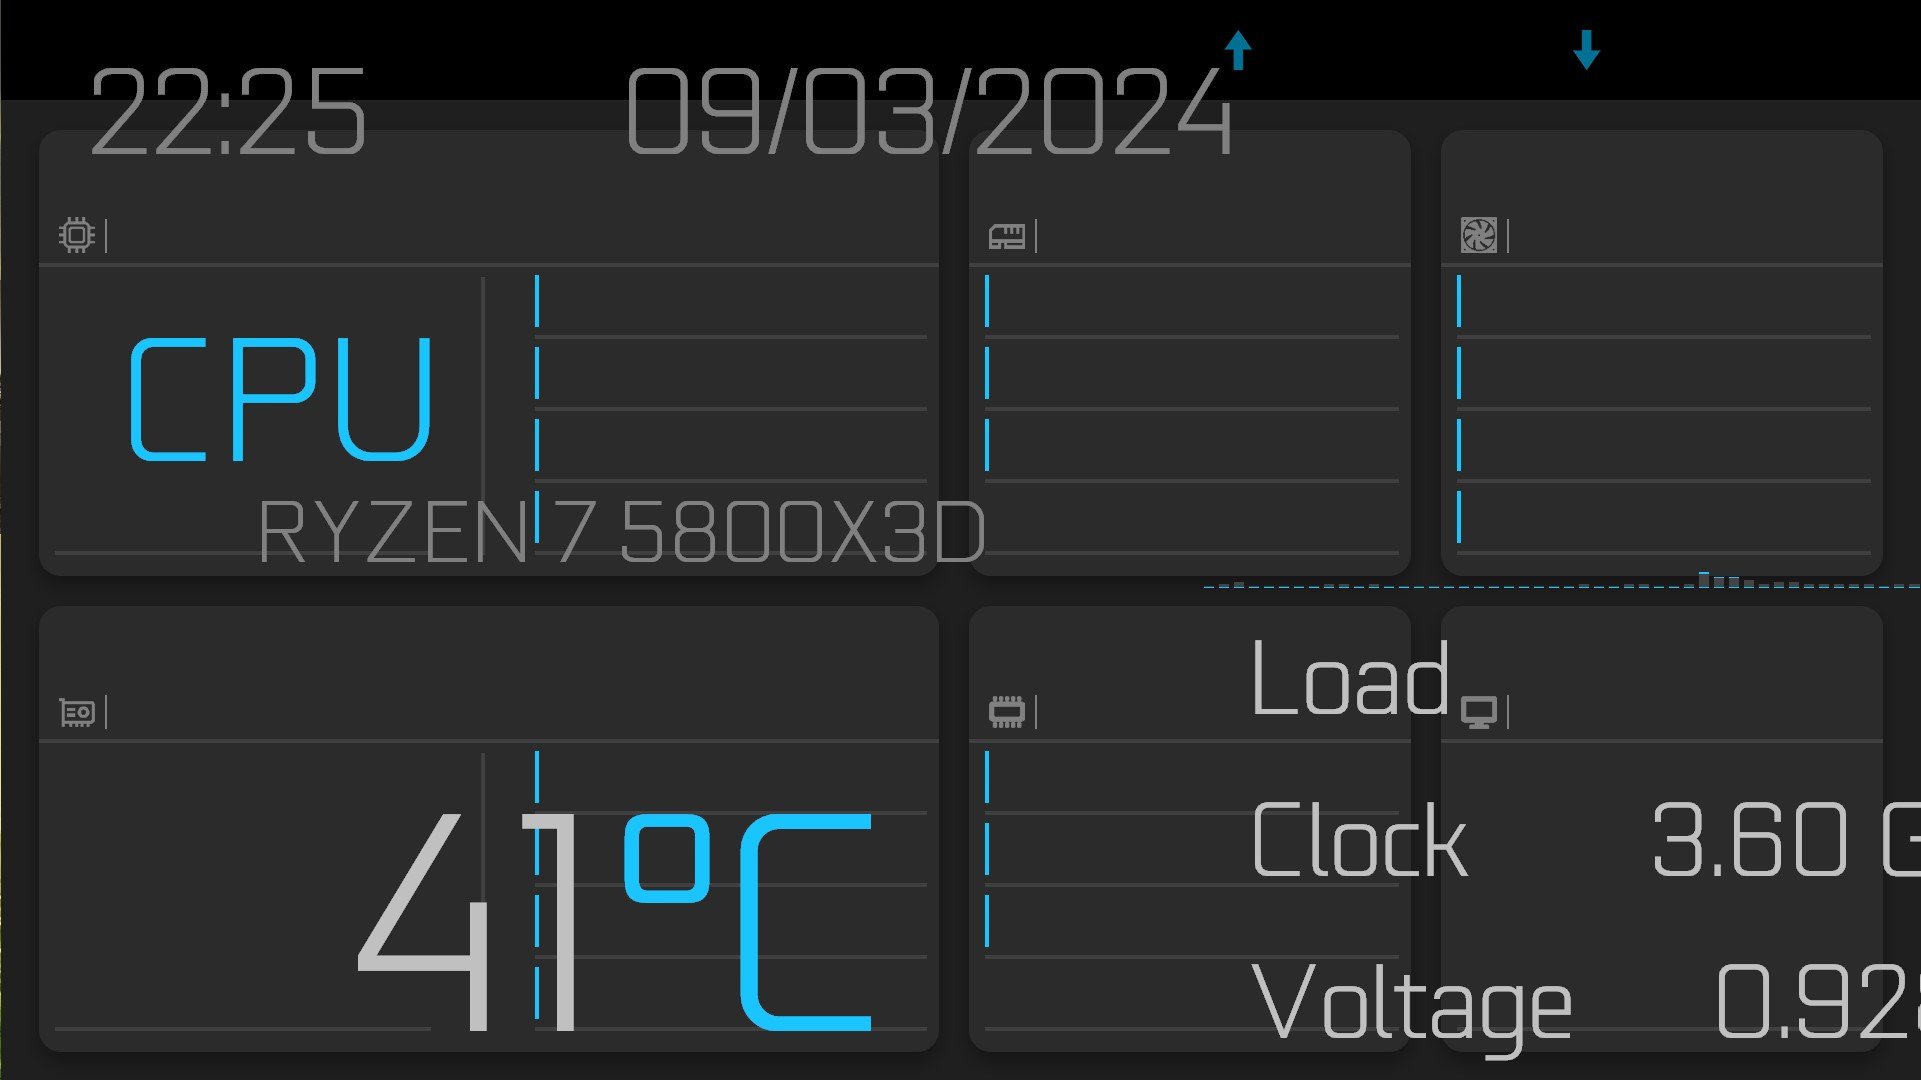
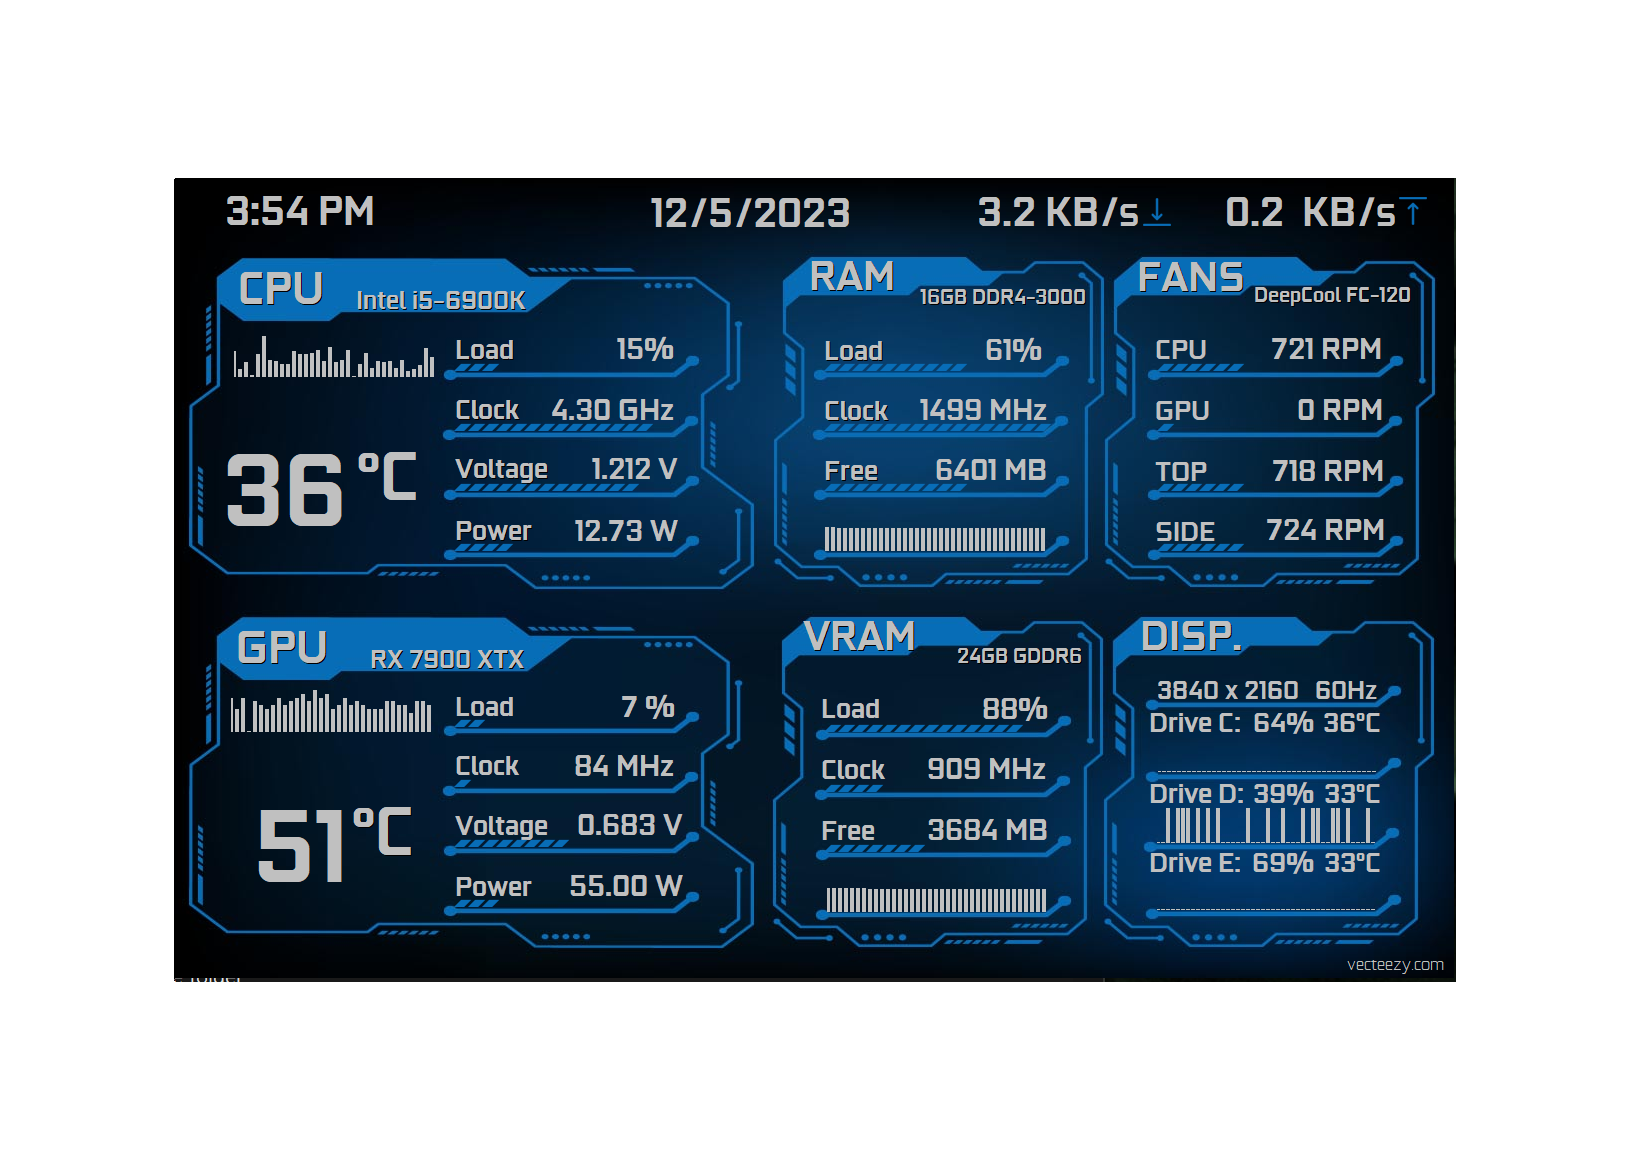
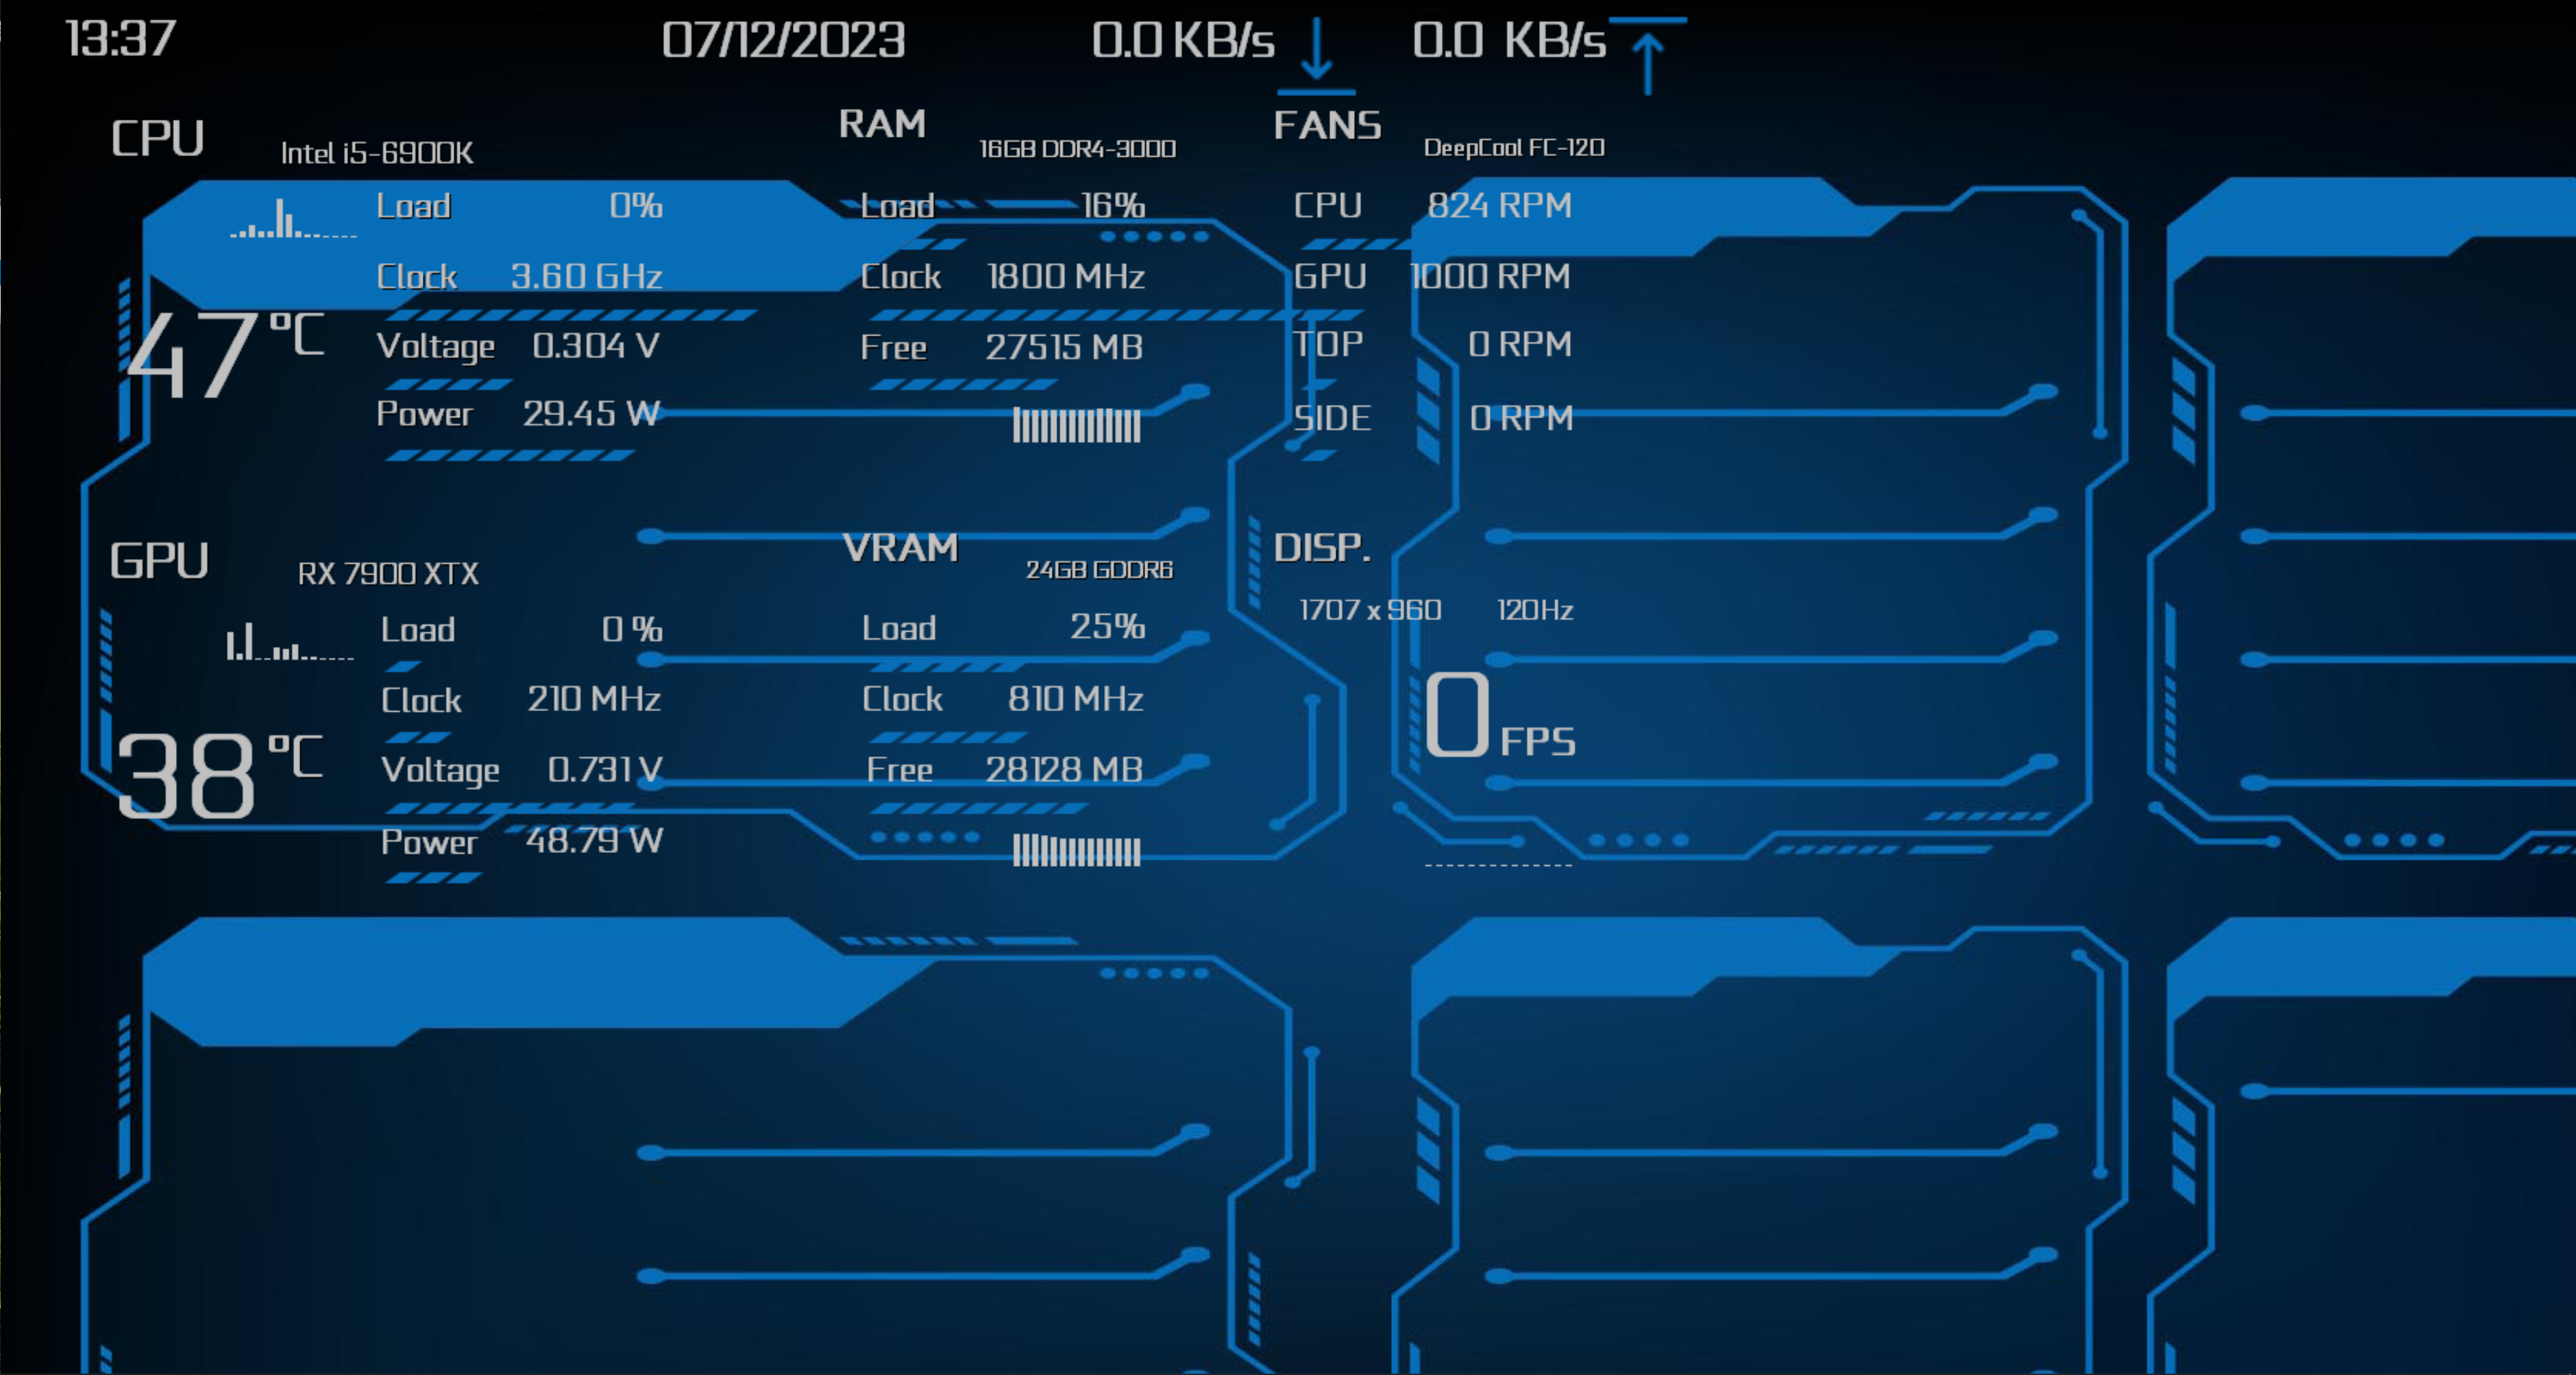
Here we have the new 7.0 version of AIDA64 and DPI scaling still hasn't been addressed.
I am on 3840 x 2160 with 225% scaling. My SensorPanel is showing resolution 1707 x 960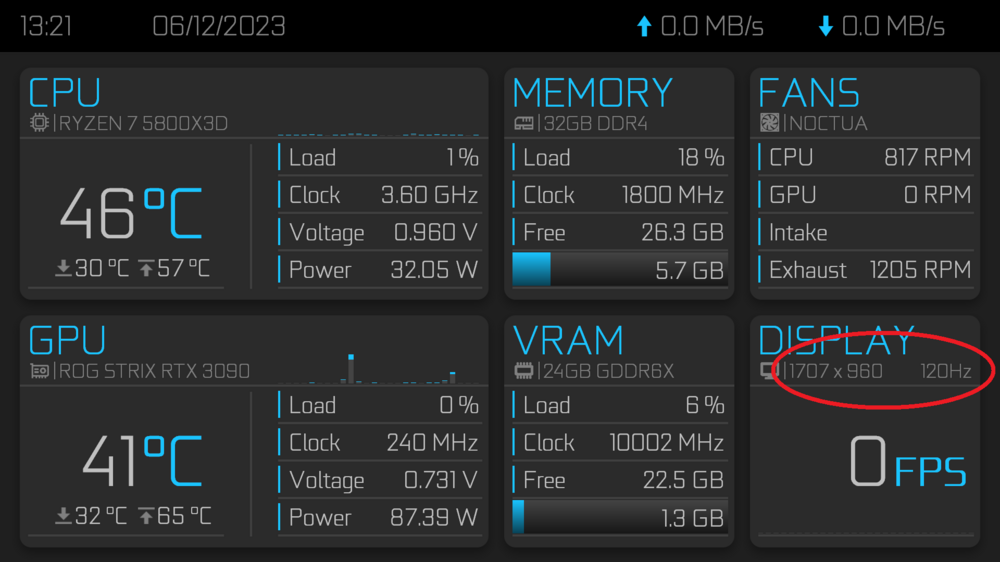
-
13 hours ago, 5150 said:
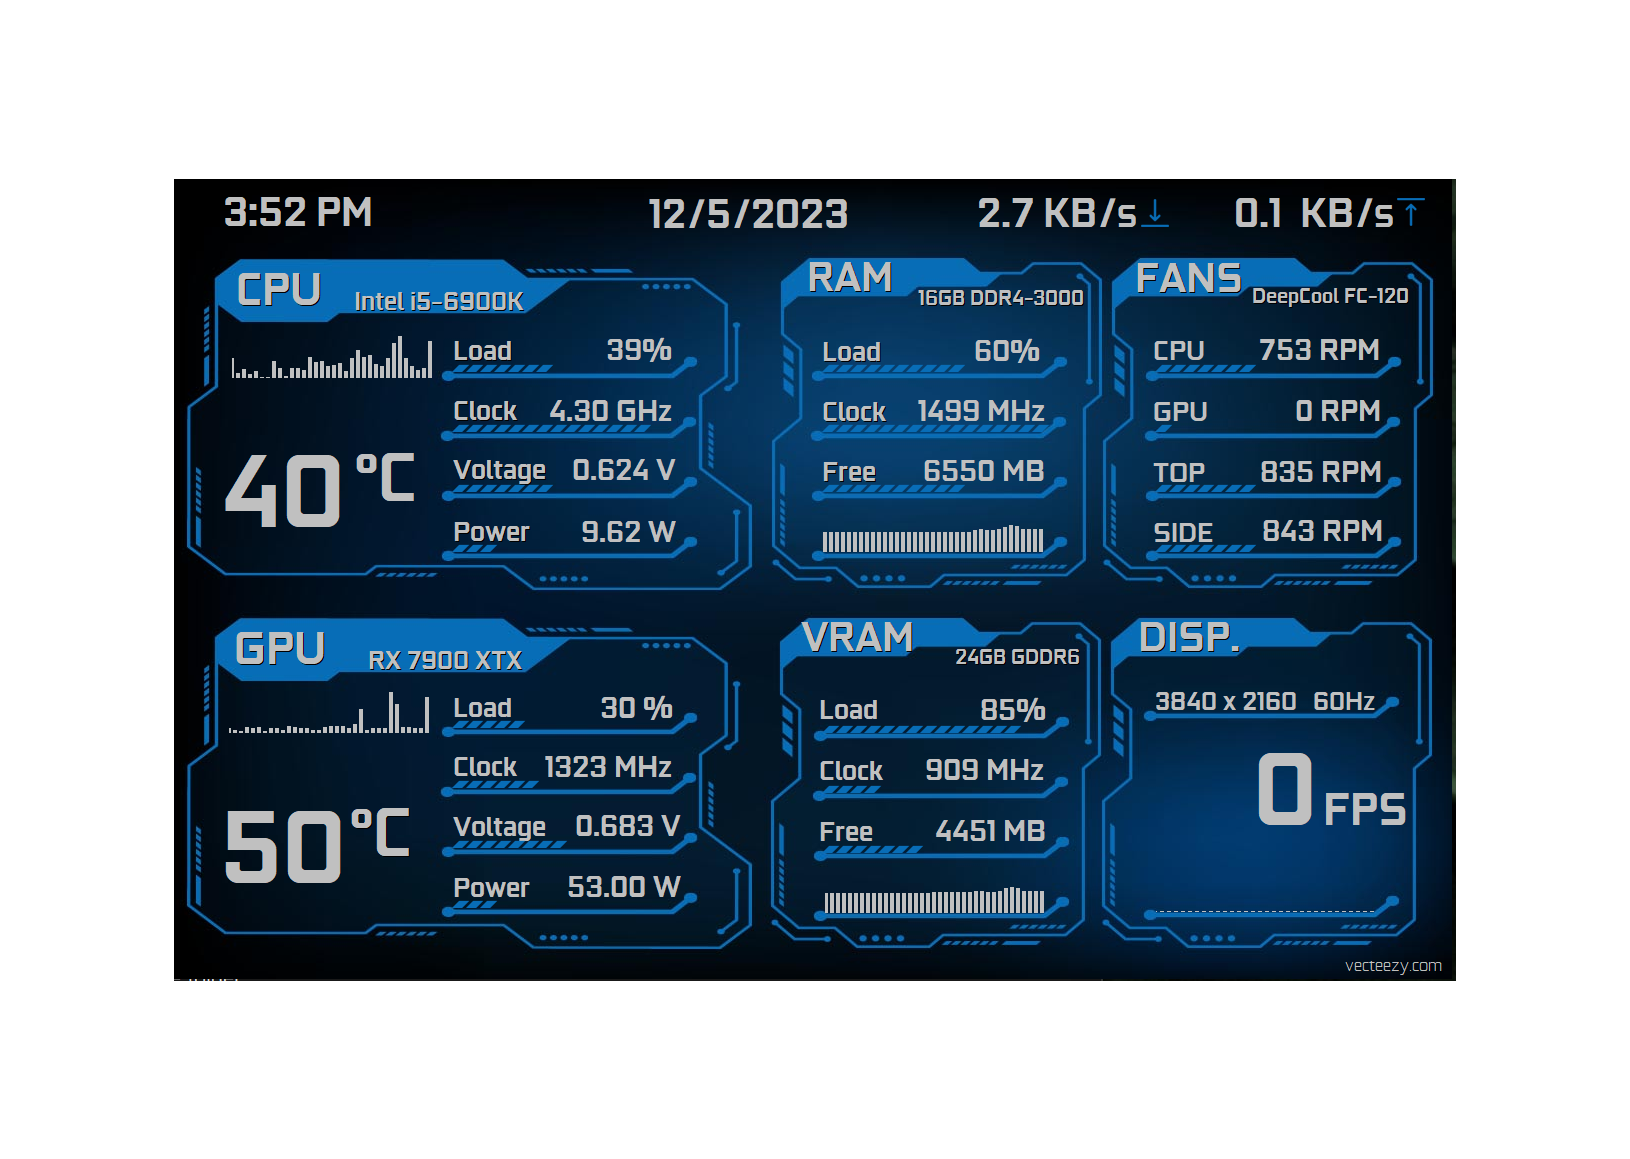
i remade the minimalist version to something more Cyberpunkish. Made 2 versions, one with FPS and another without it and has Drive information. Since I used Vectors from a website I have to place the website on the design.. it is a LABEL so you can remove it. Also each sensor has its own horizontal gauge. I hope you guys like it. 1280x800
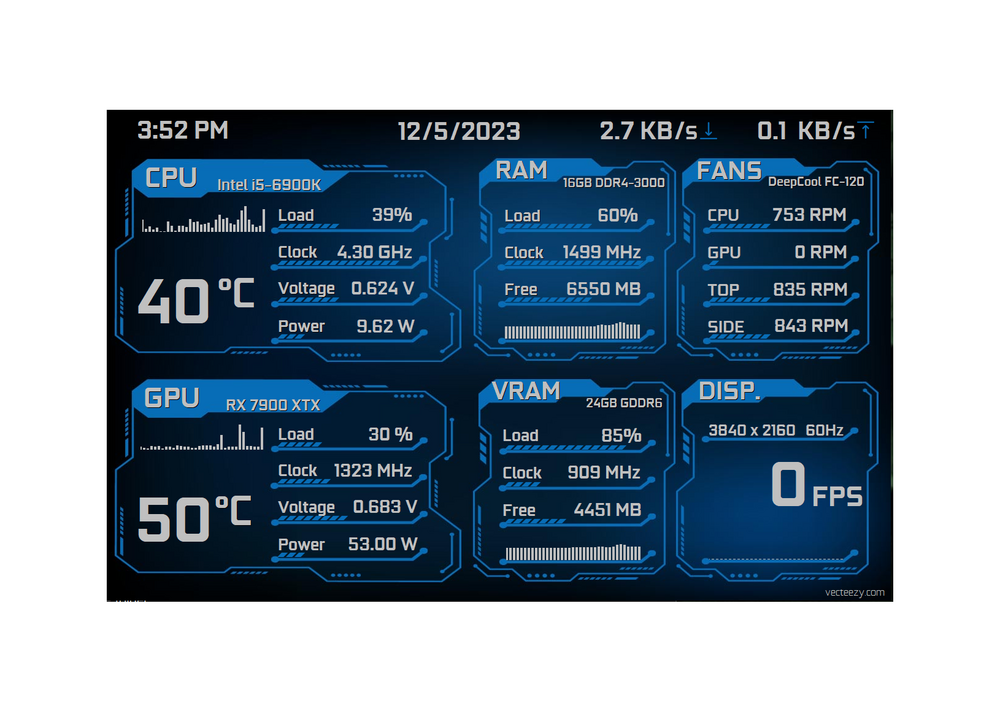
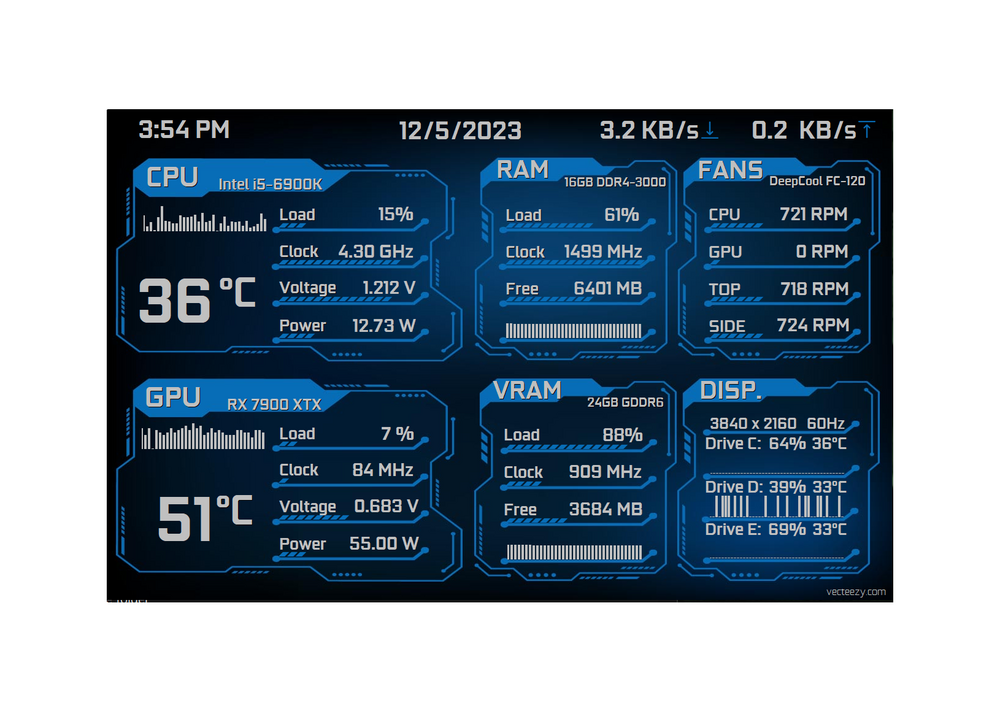
CyberBlueV1.sensorpanel 421.3 kB · 17 downloads CyberBlueV2.sensorpanel 425.21 kB · 11 downloads
Very clean and futuristic design. Well done. Any chance you can release a 1920 x 1080 version?
-
1
-
-
3 hours ago, 5150 said:
Updated to V2 my first attempt at making a custom gauge, pretty tedious work but I finally got it working correctly. 1280x800.
 8 hours ago, Pavlin Shterev said:
Here's my take on the minimalistic template for Hyte Y70's display (14.1” 1100 x 3840px).
Lovely to see my simplistic design is quite popular among SensorPanel enthusiasts!
-
1
-
-
On 8/21/2023 at 7:32 PM, 小林麵線 said:
Sorry to bother you, do you know what font it is using?
I'm afraid not. I didn't make those SensorPanels.
-
7 hours ago, Jamson Borne said:
I saw this starfield skin on reddit. Could someone replicate it in 1366x768
THANK YOU VERY MUCH
I like to see a lot of people use my minimalistic SensorPanel design and make it their own.
-
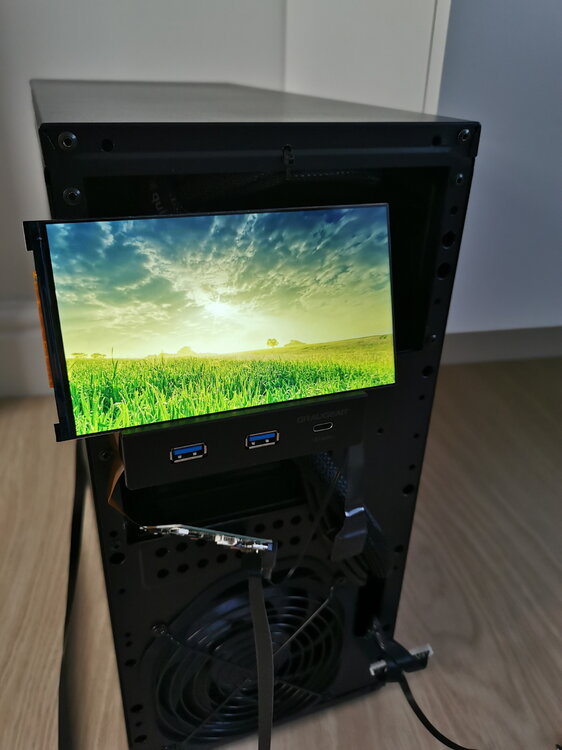
1 hour ago, Dropcheck said:
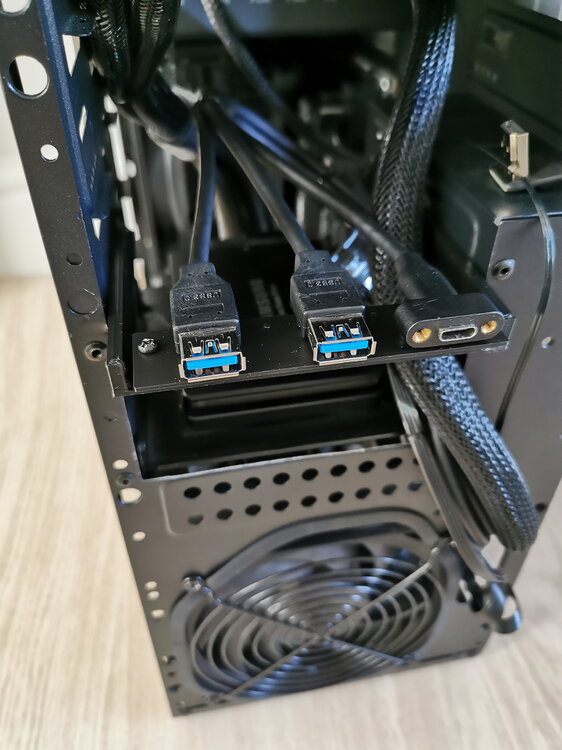
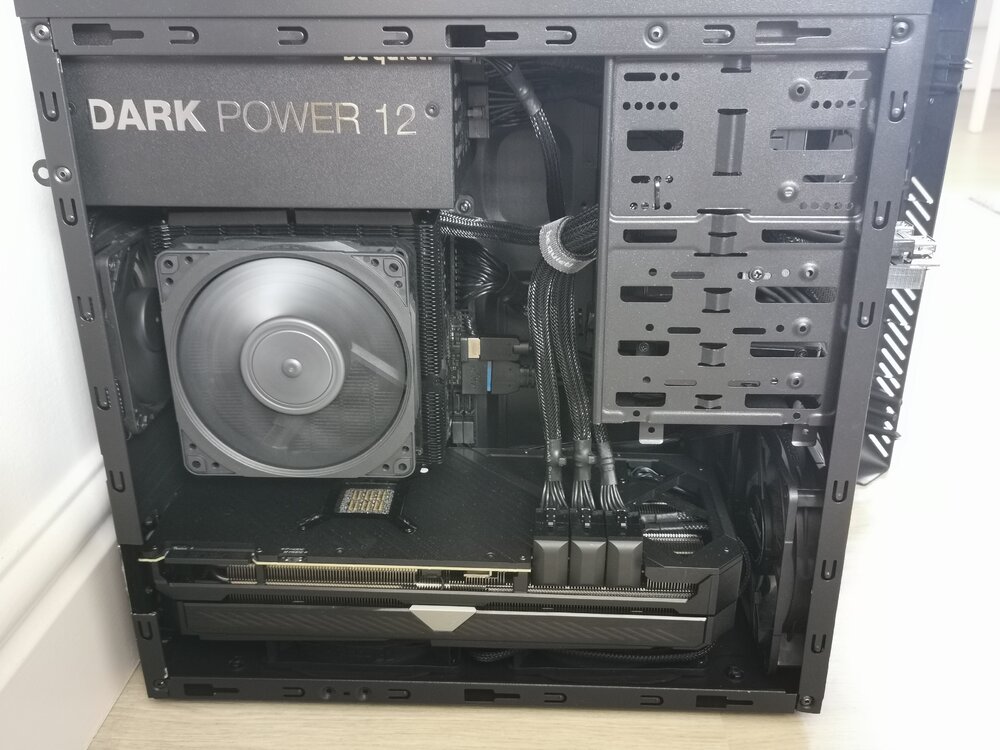
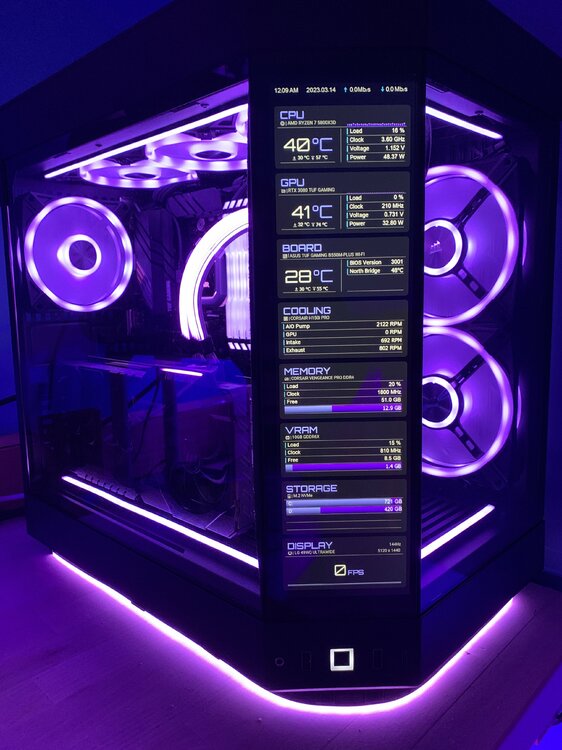
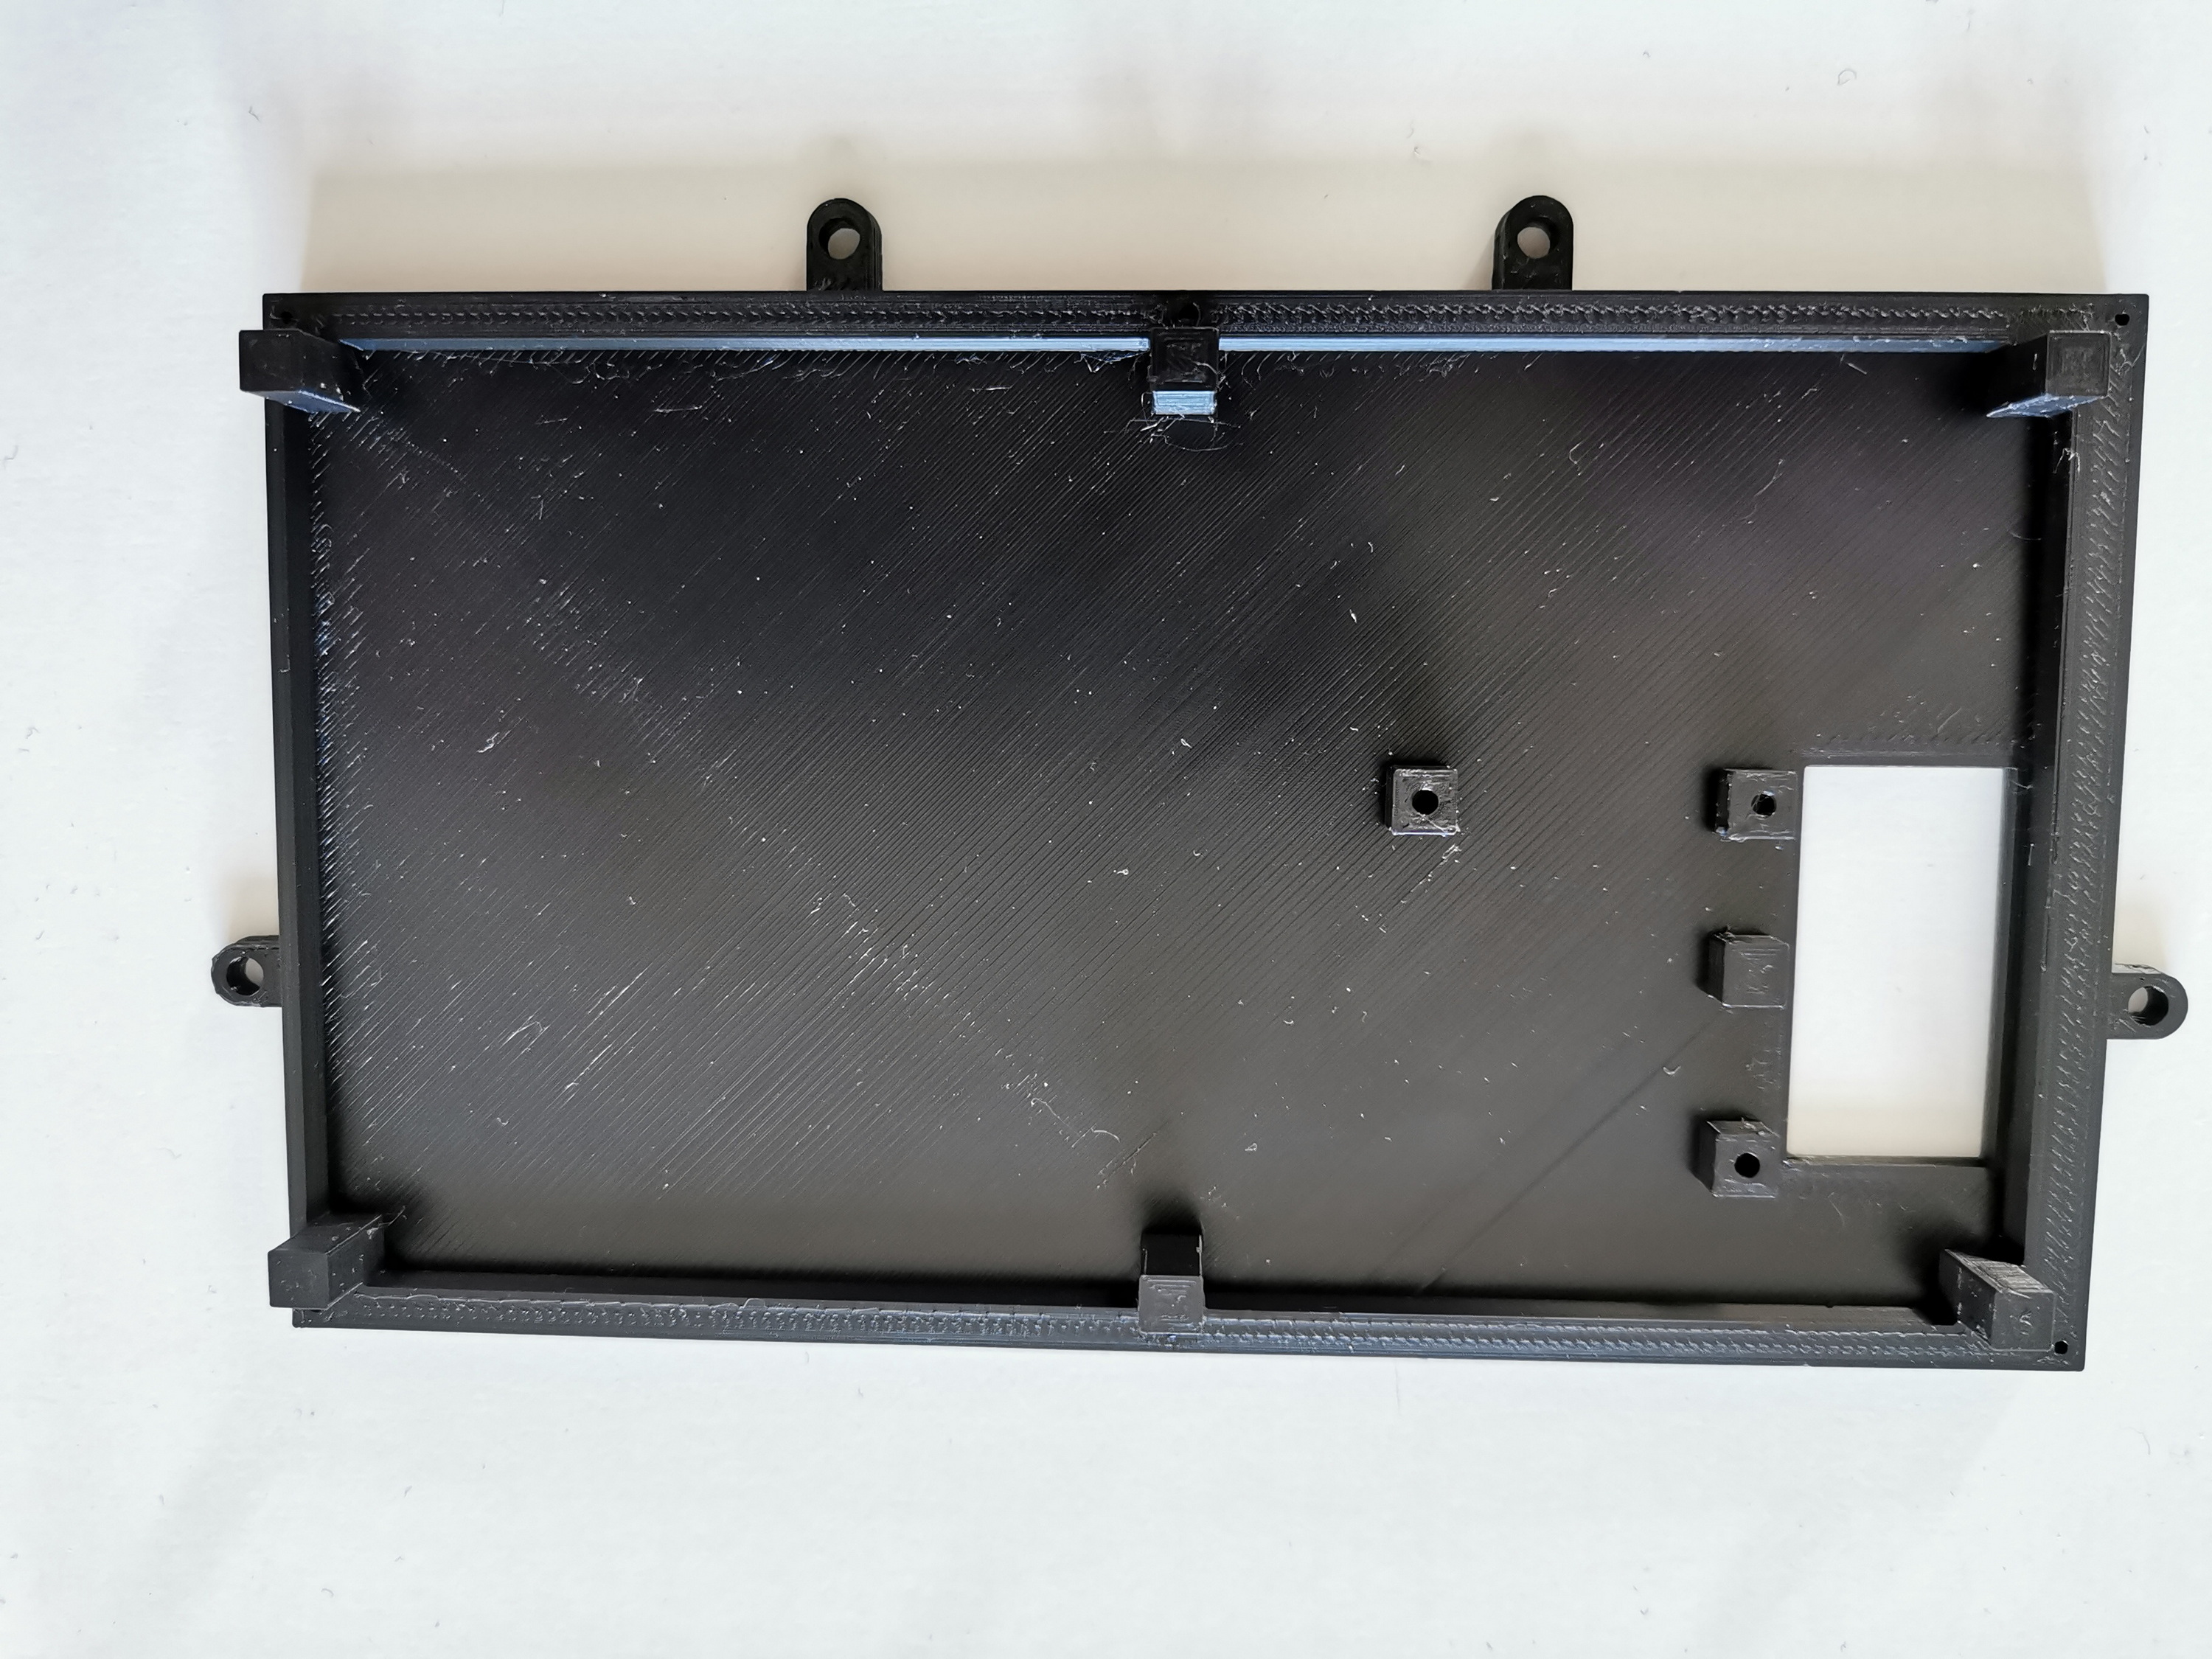
I like that. Can you give us some more info on the case mod and display screen fitting?
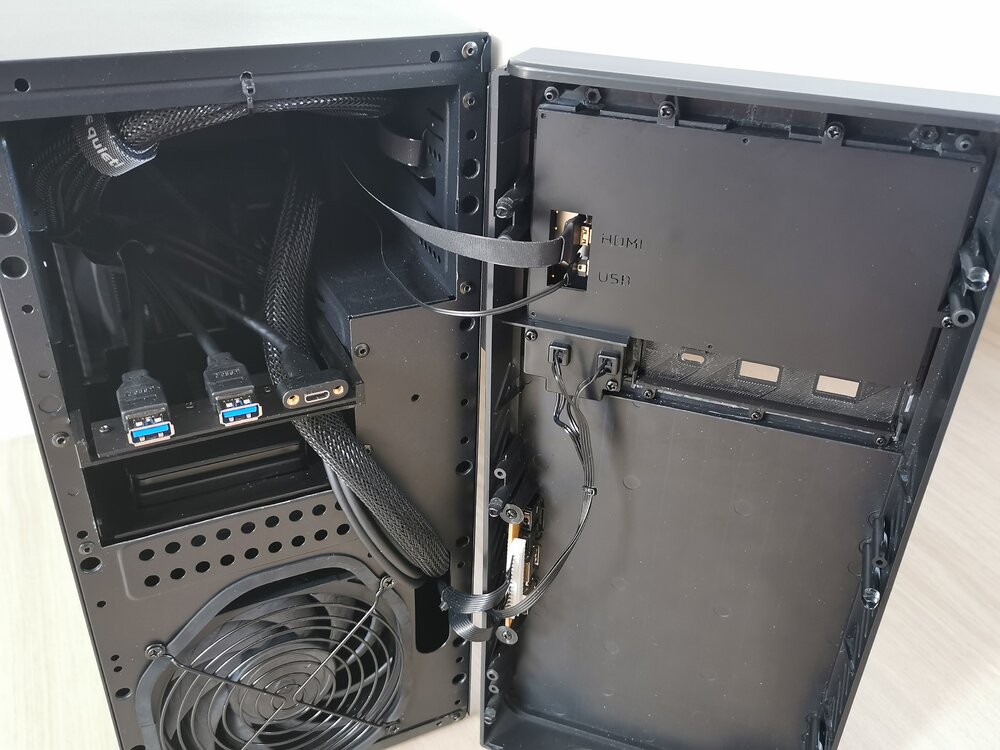
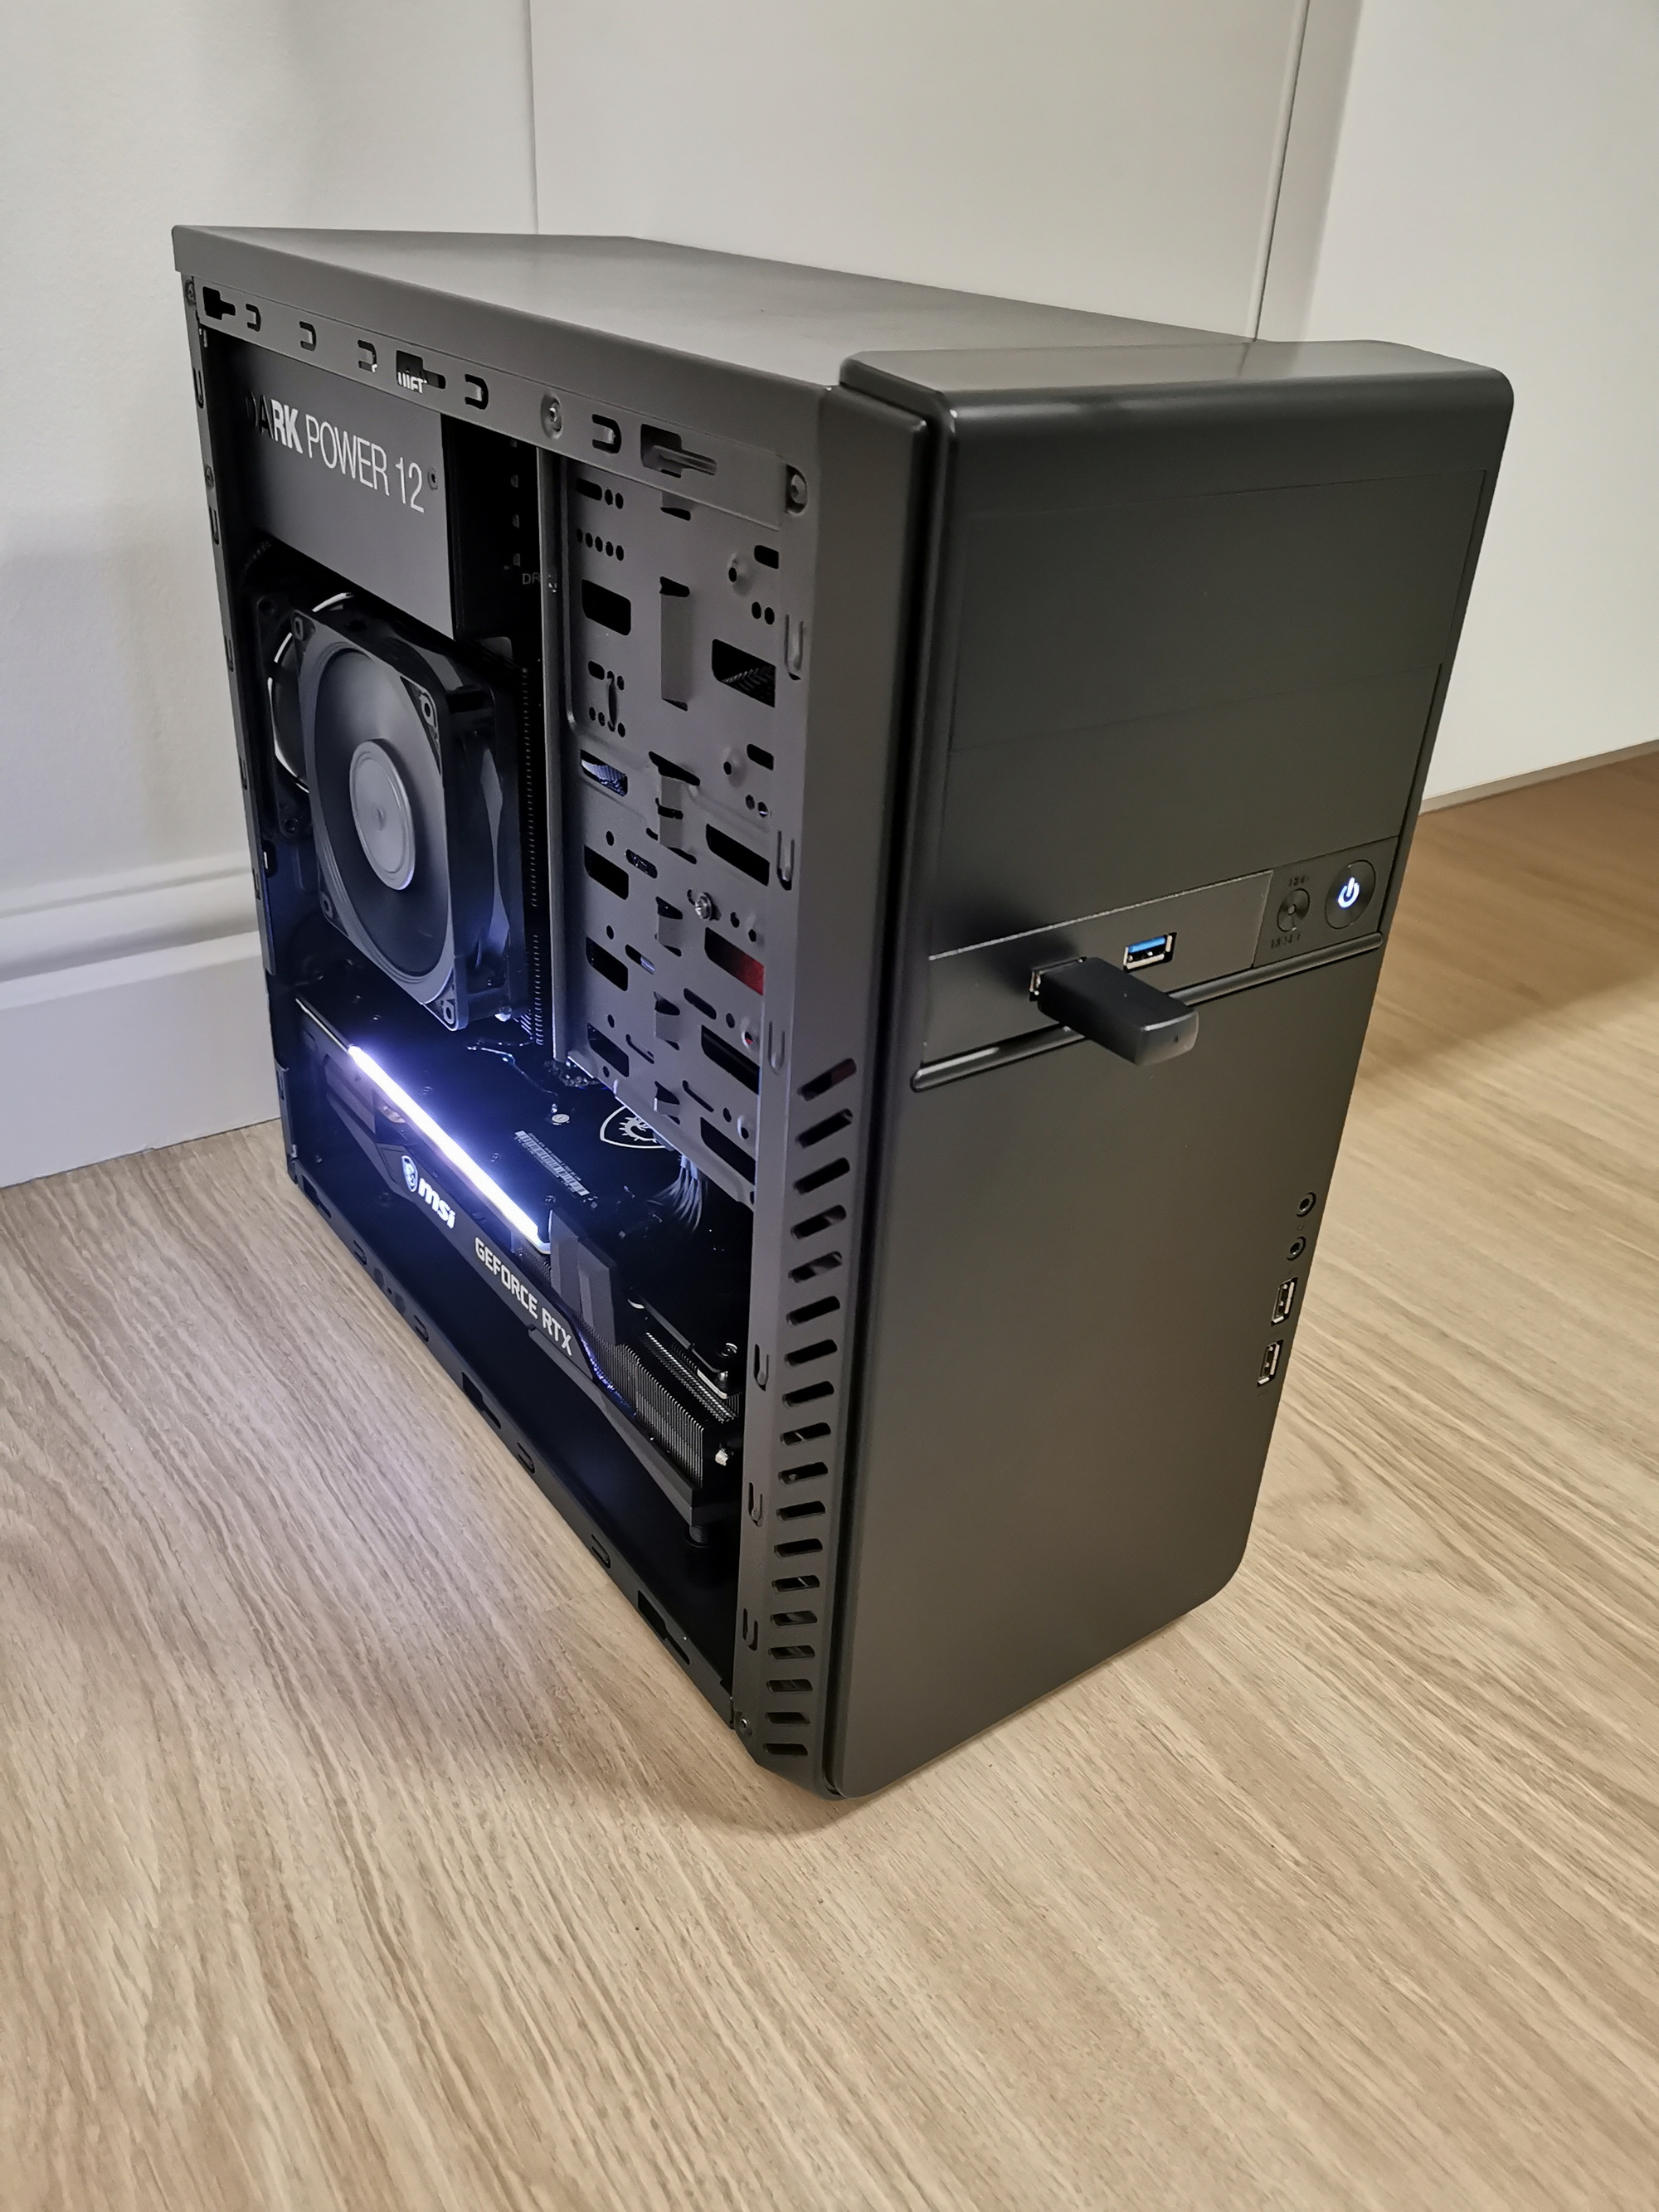
Case itself is just a generic unbranded one with some mods to support extra 2 120mm fans at the bottom for the GPU intake.
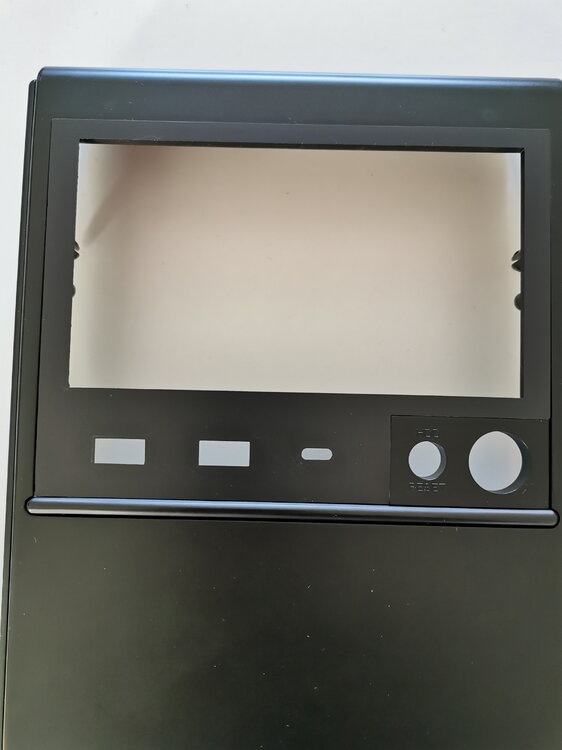
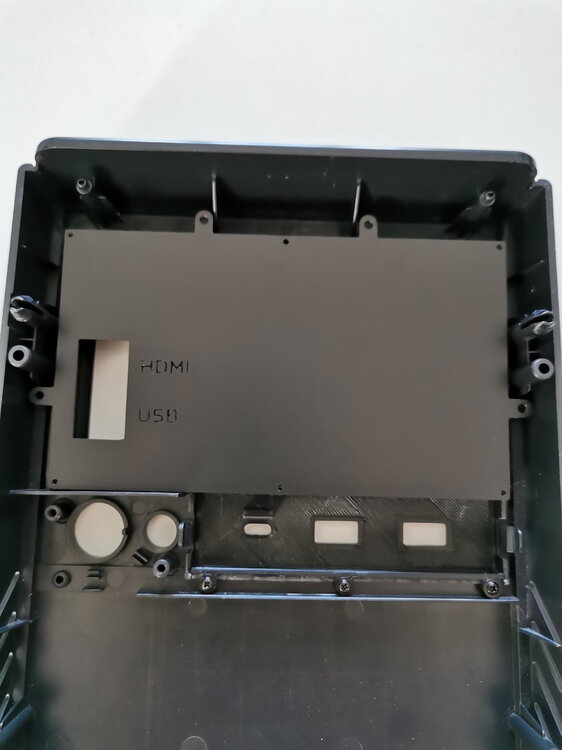
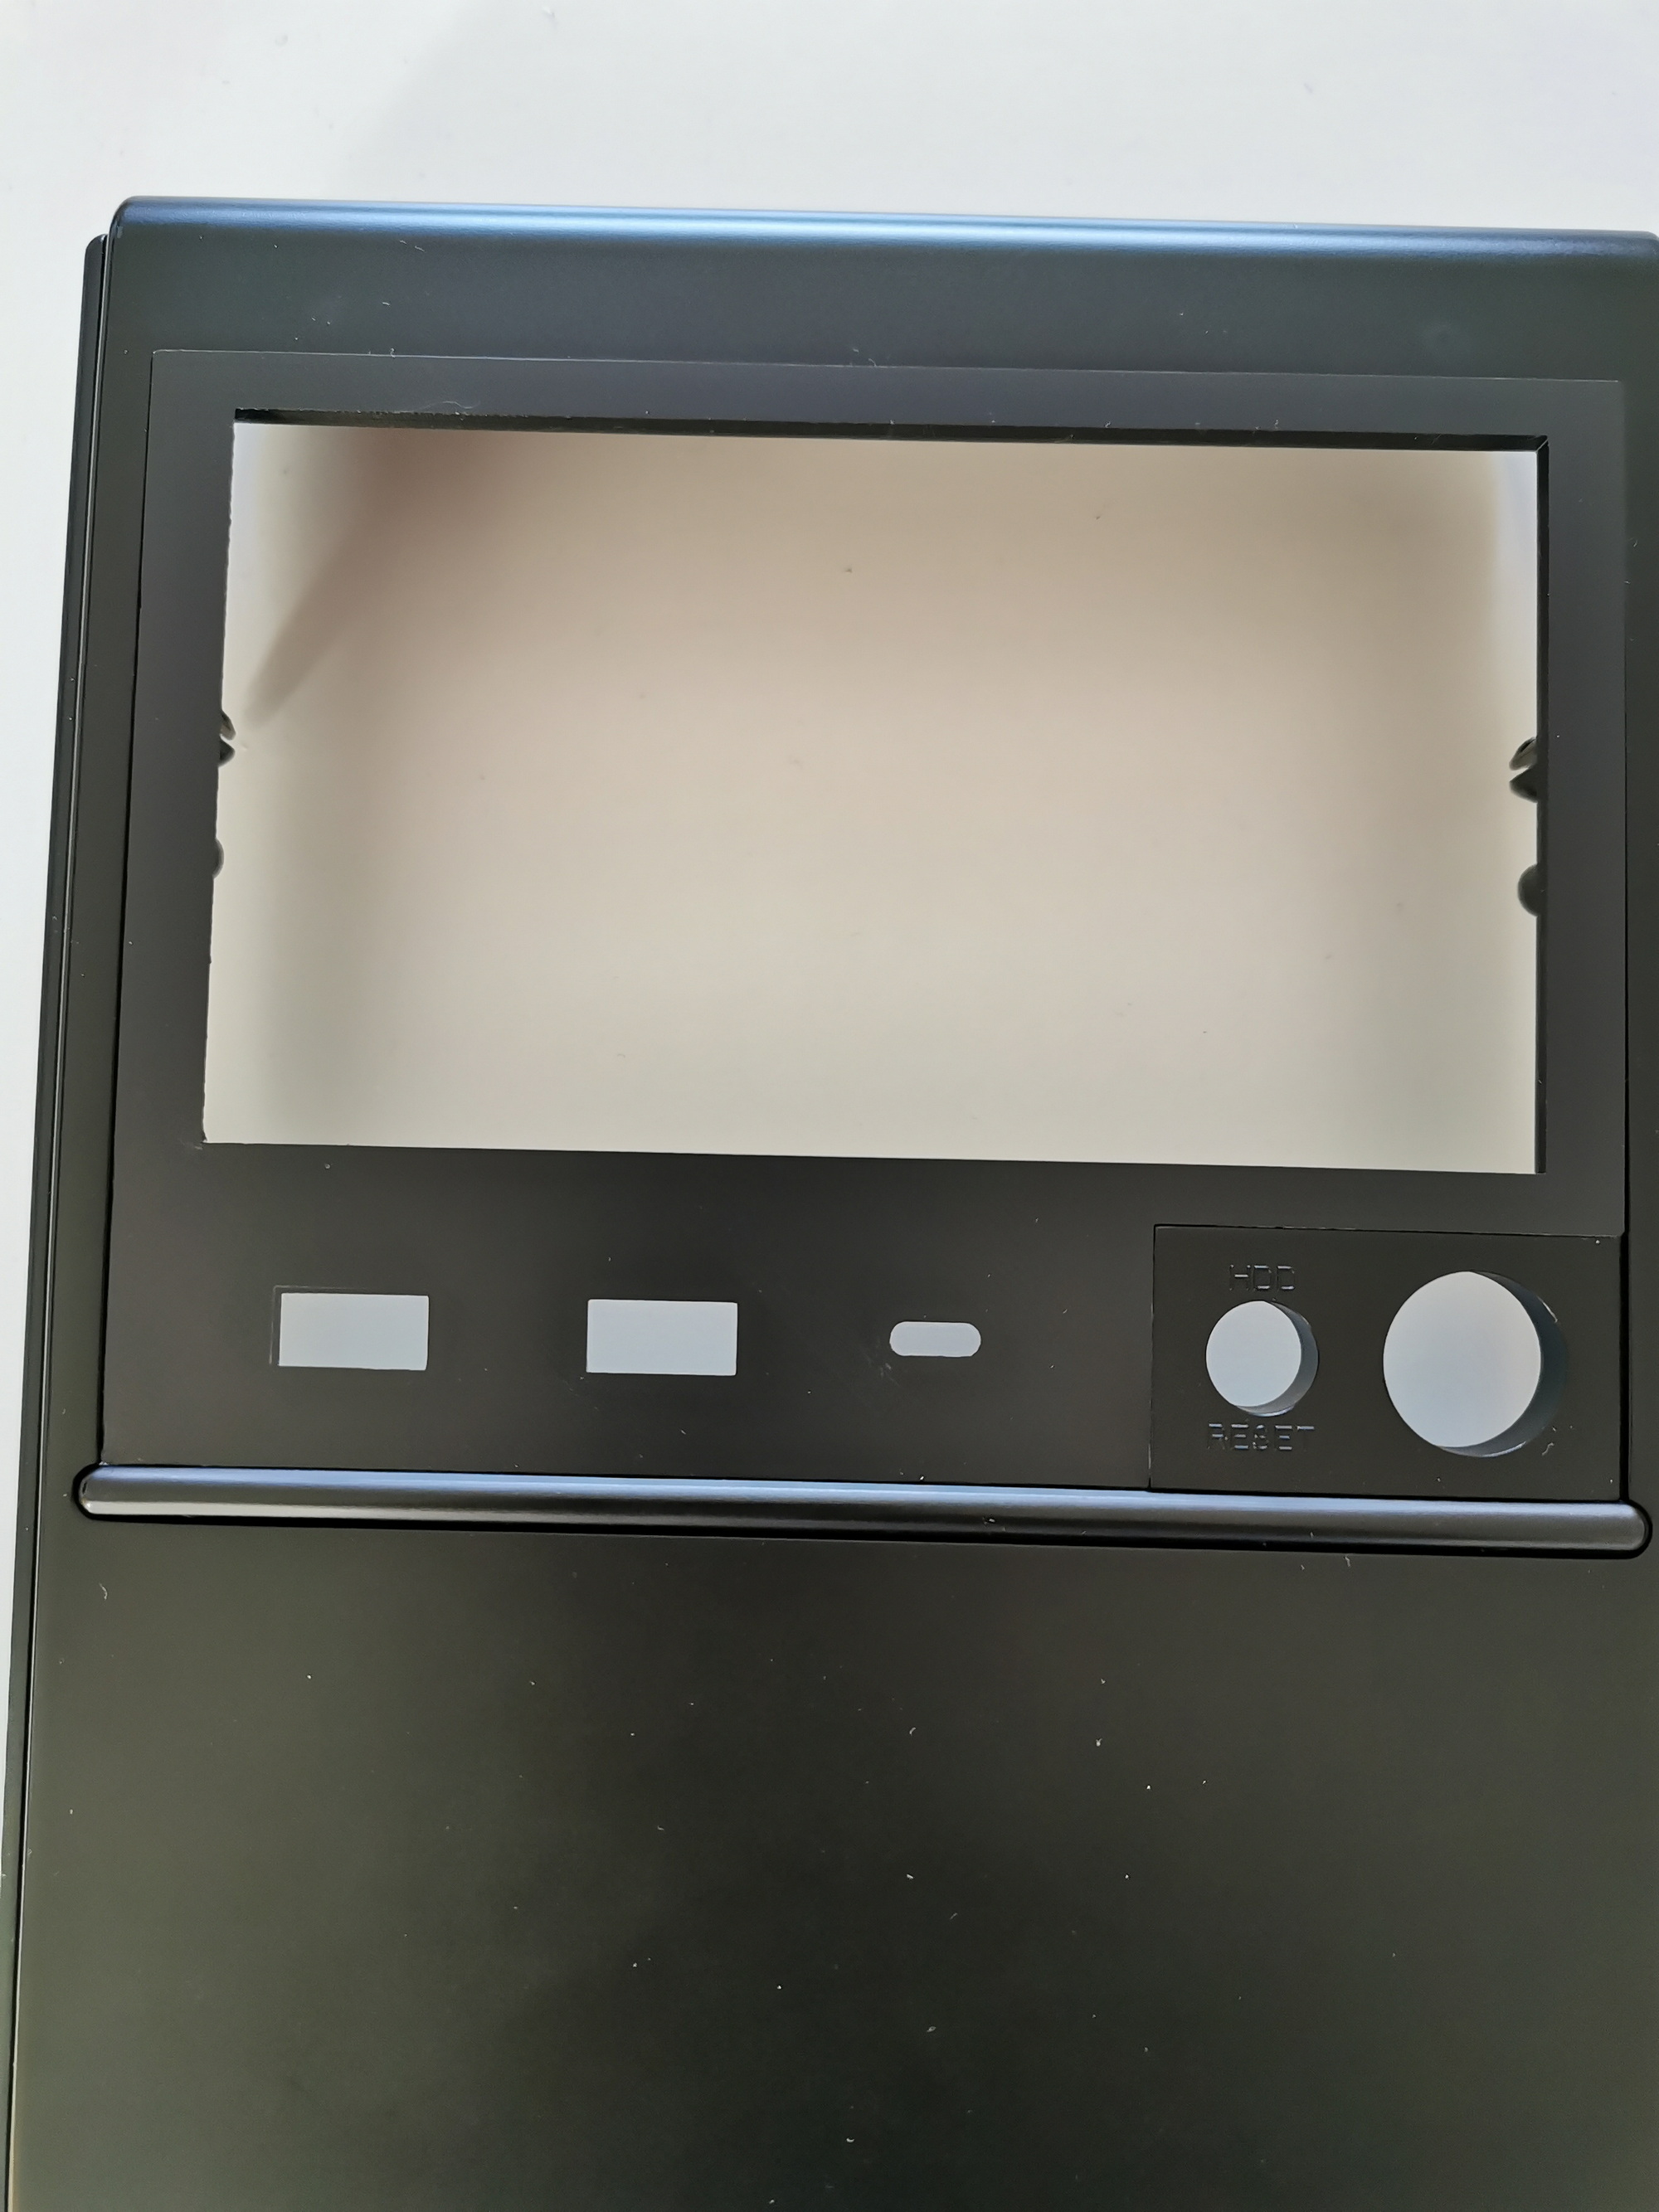
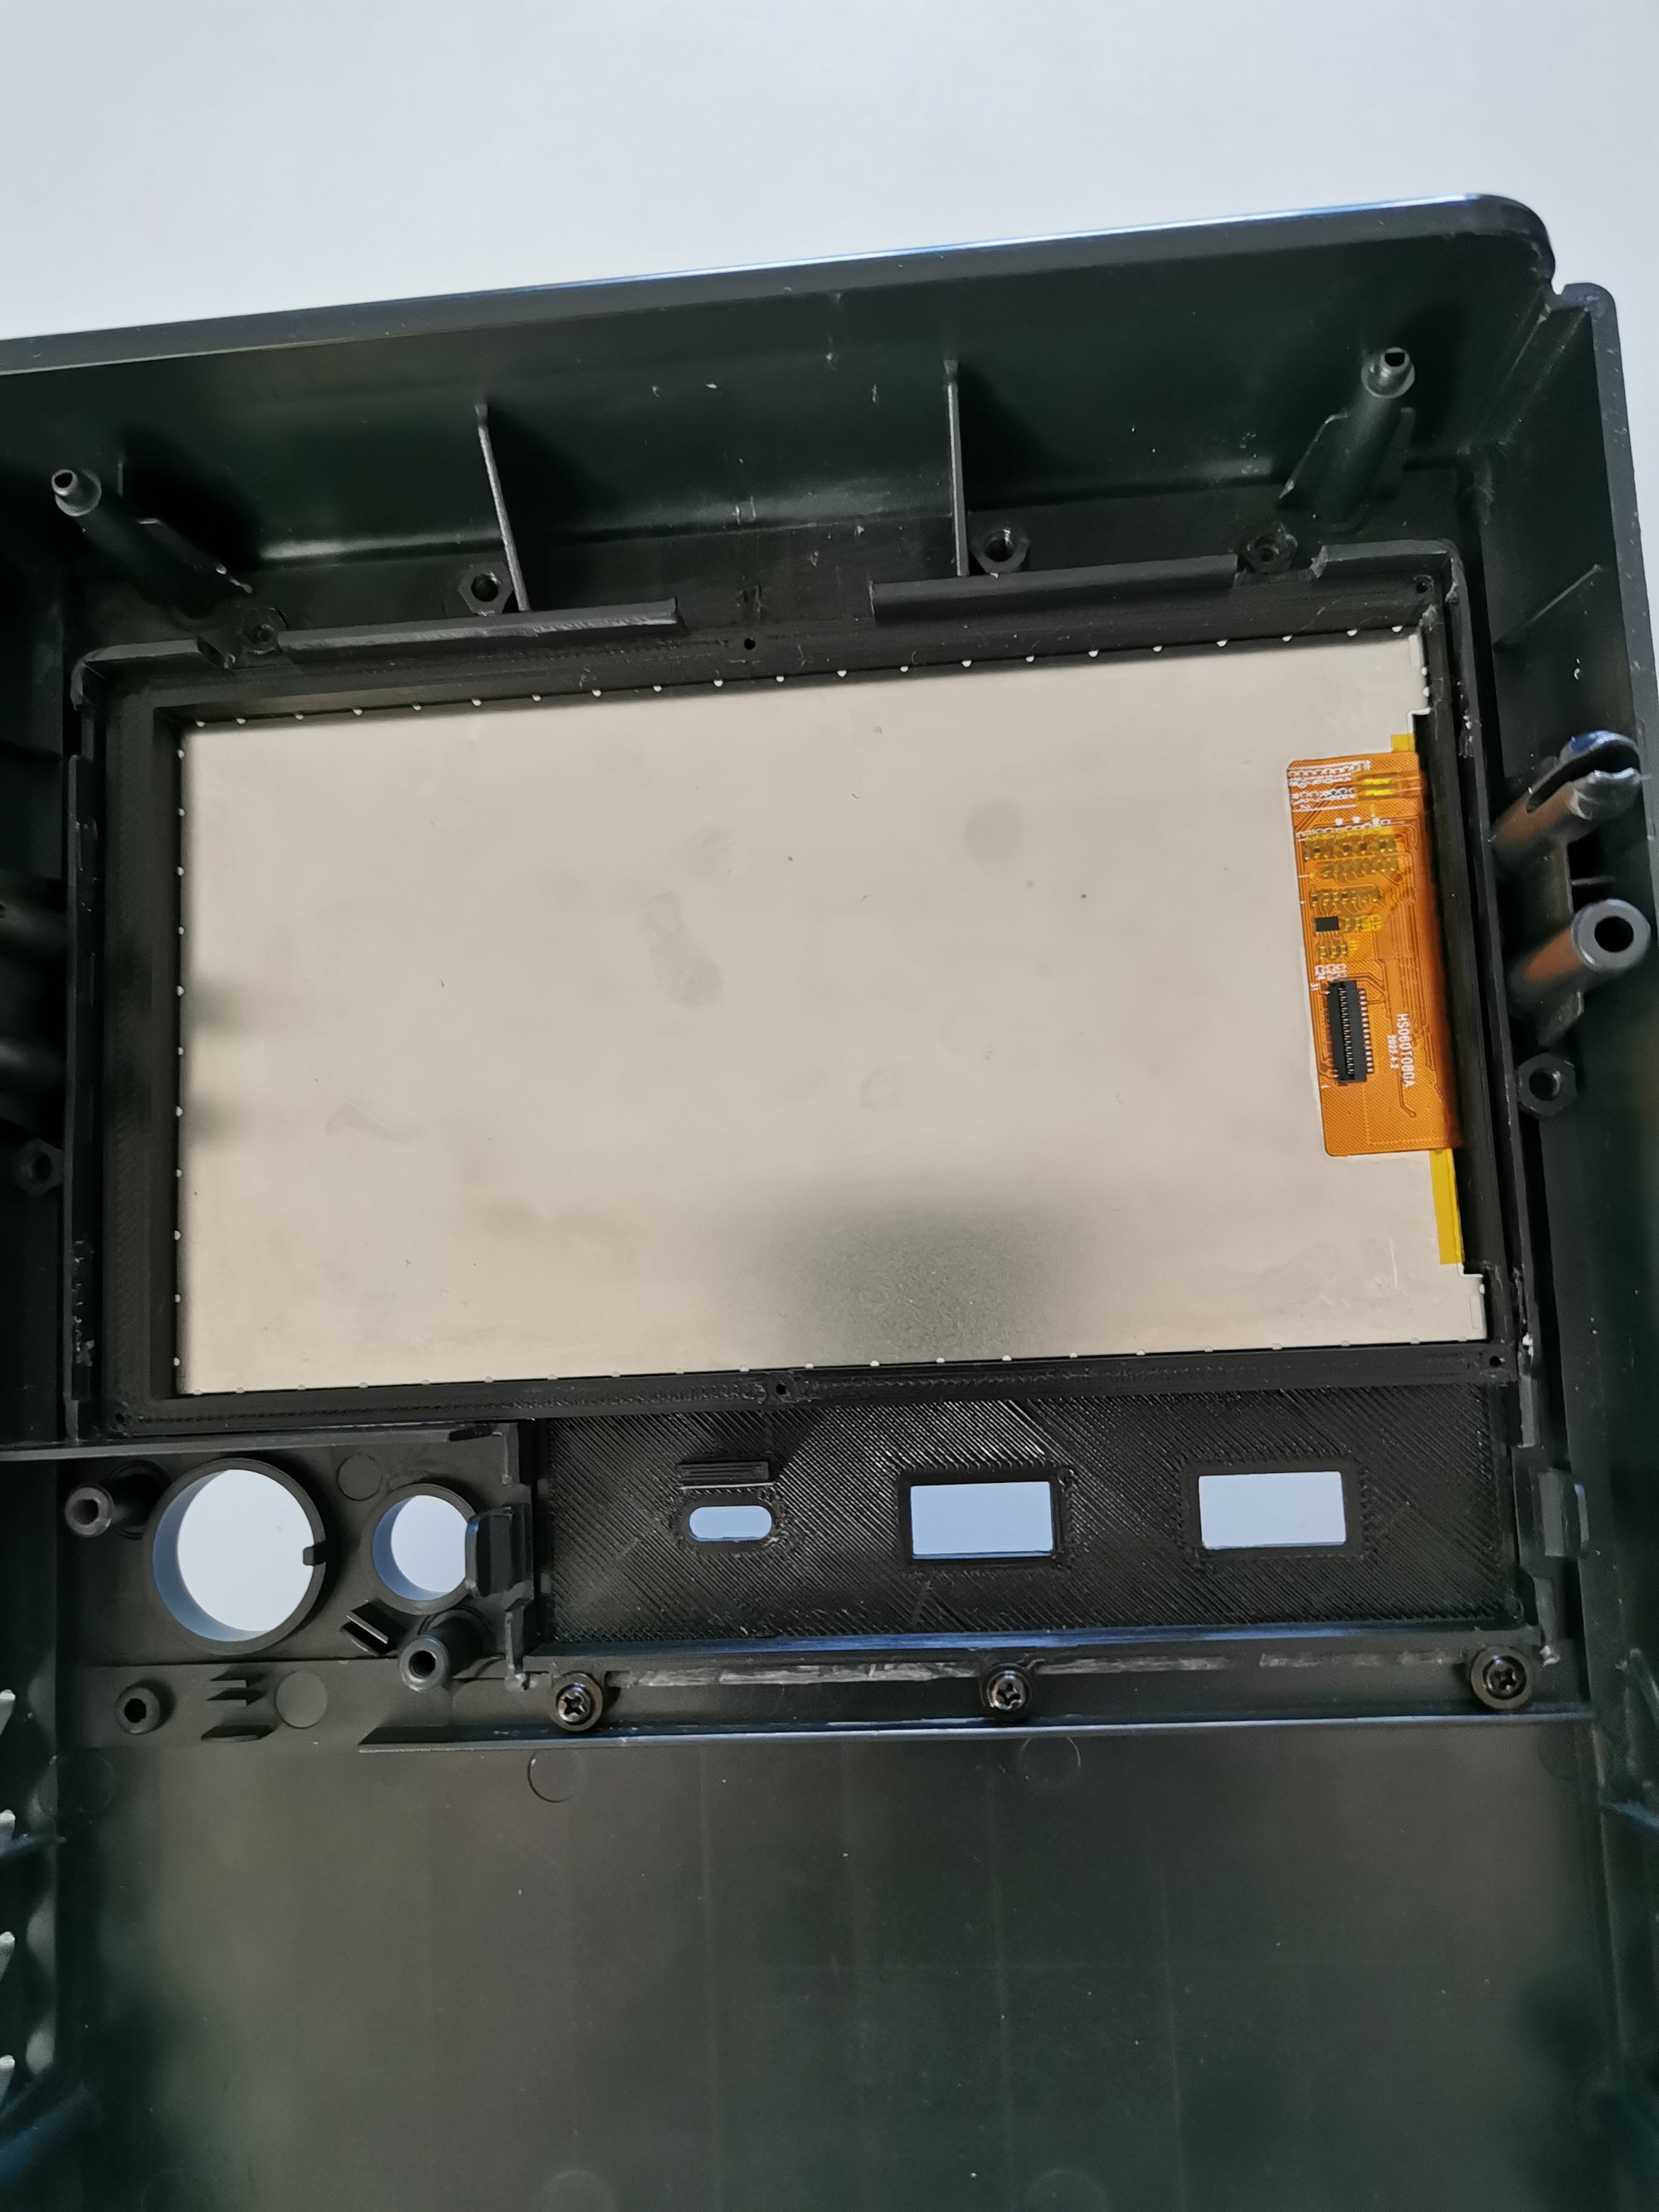
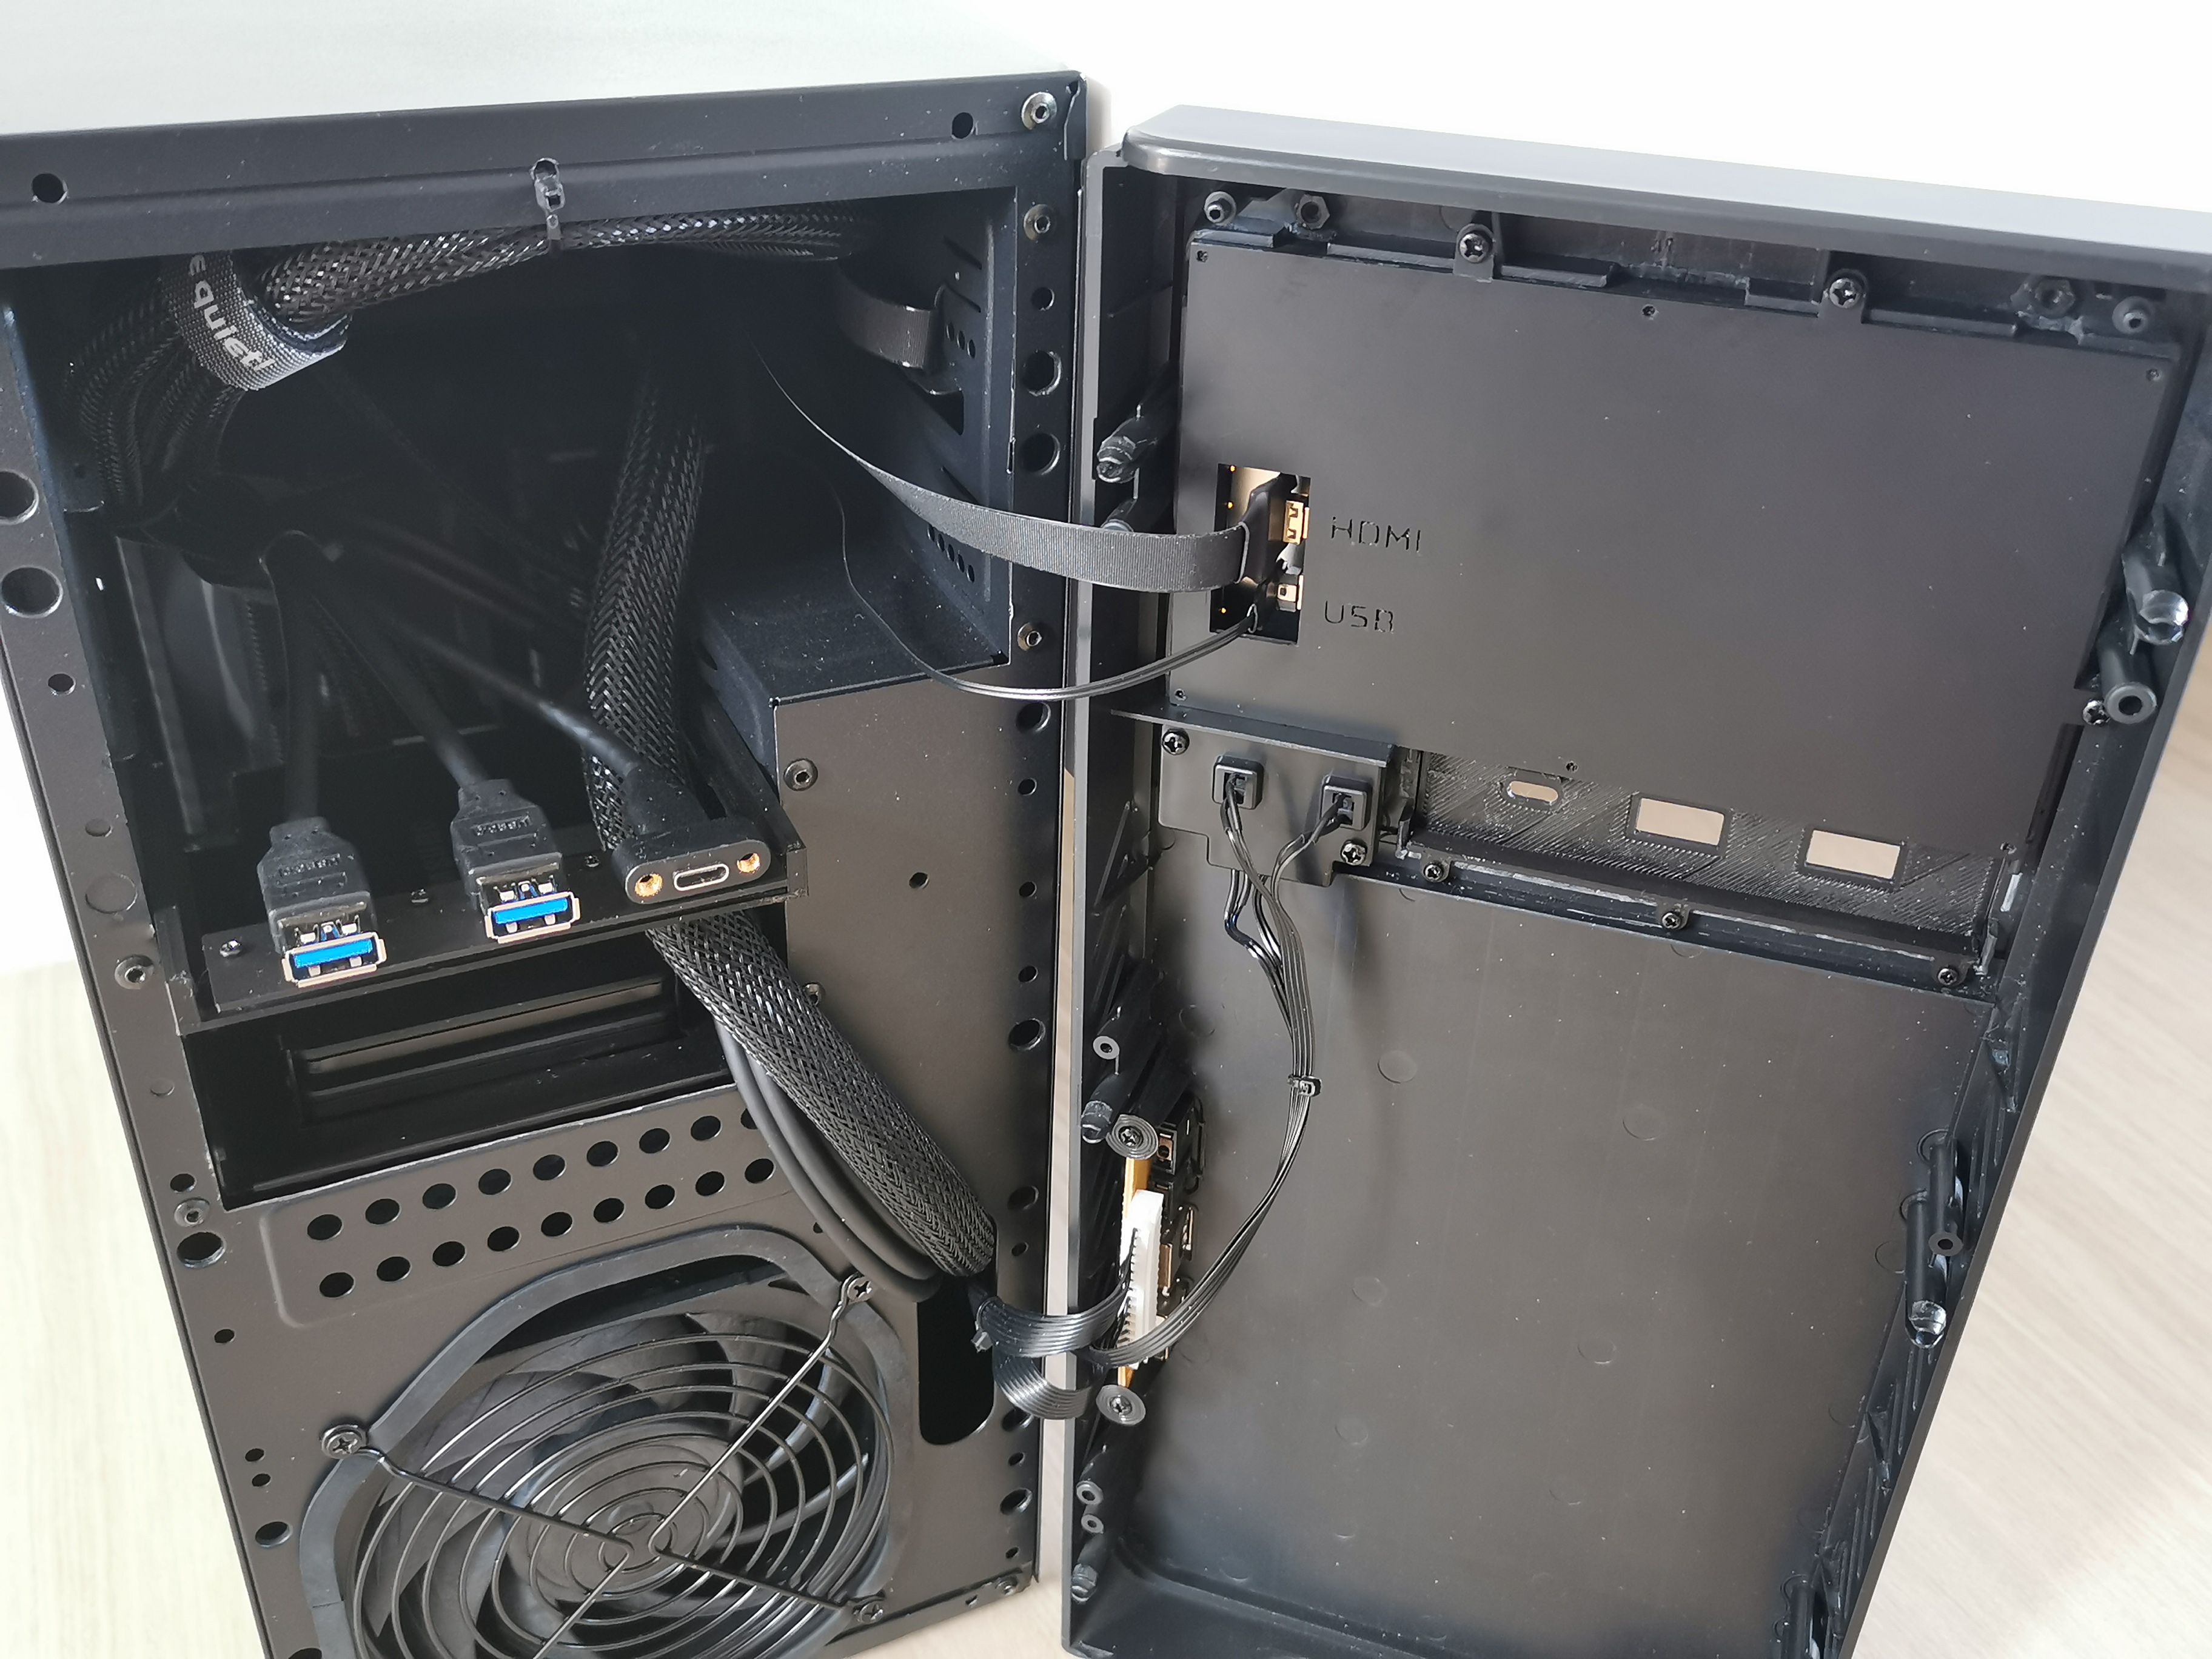
Used a 1920 x 1080 LCD screen from aliexpress which came with it's own enclosure. I took it apart, designed and 3D printed my own custom enclosure with integrated usb hub faceplate for it. The whole goal of this project was to make everything have a clean and modern yet industrial look.


-
3
-
-
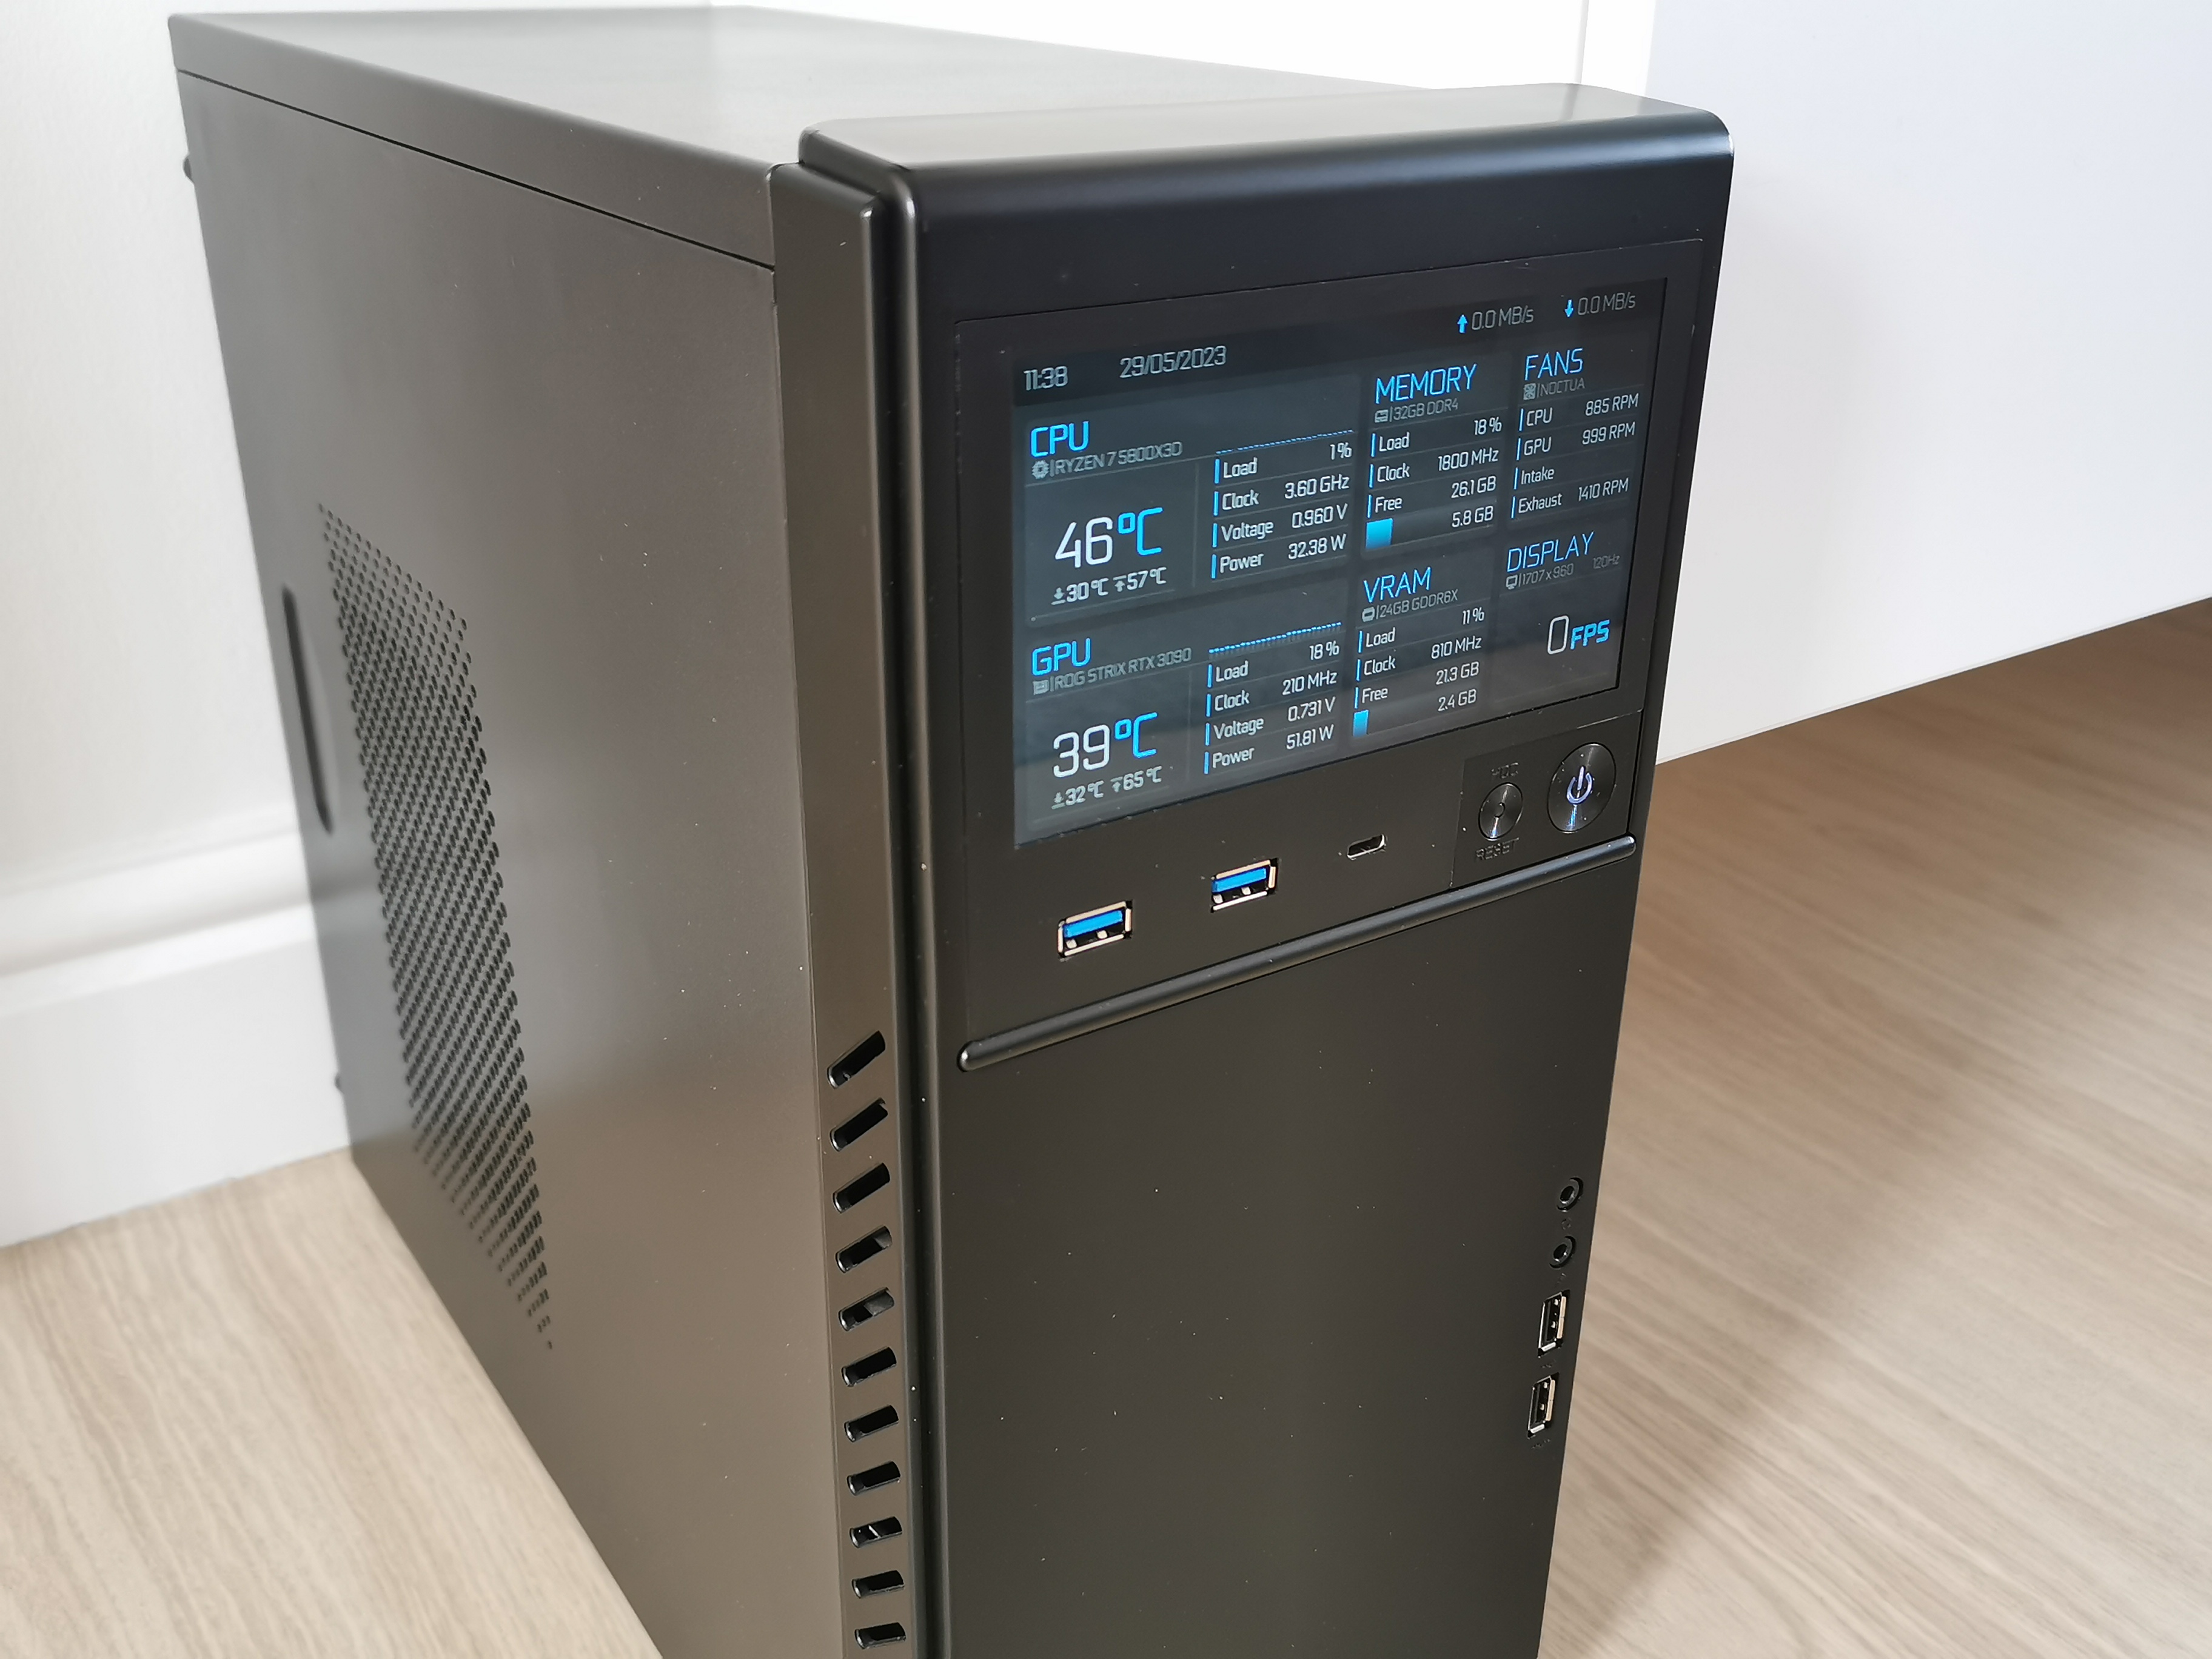
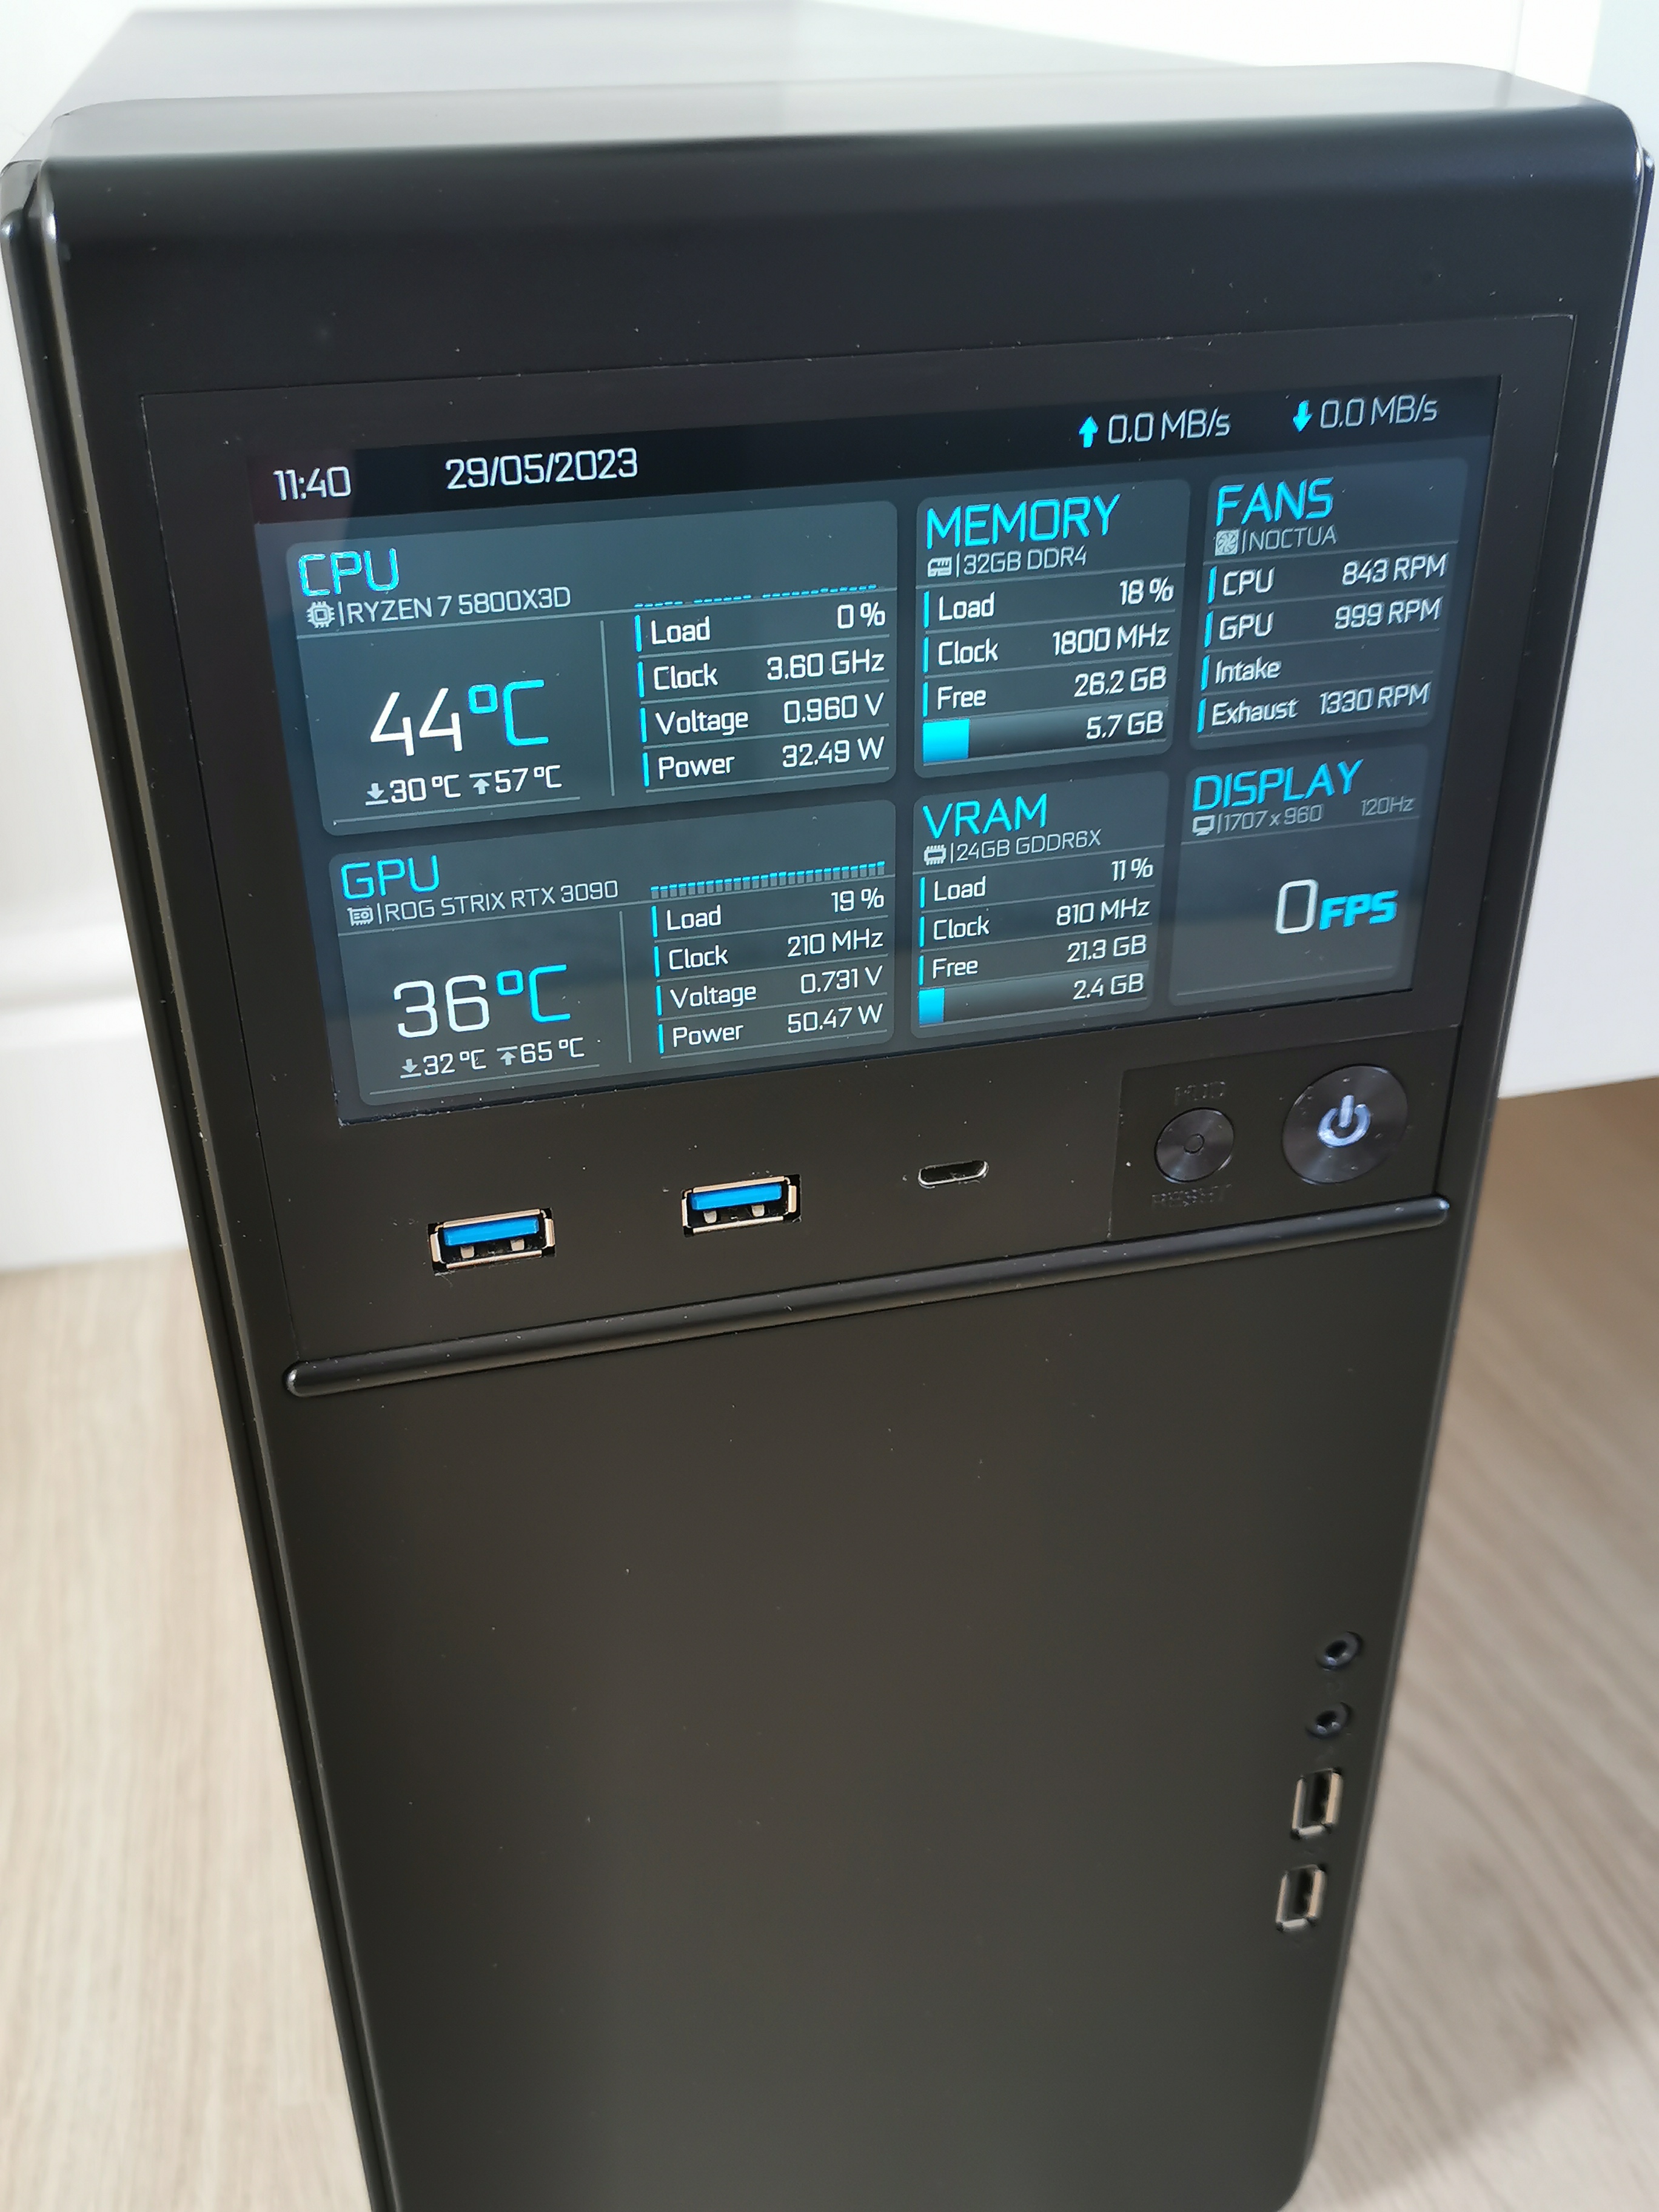
My sleeper build with custom made screen enclosure and my minimalistic SensorPanel which is available for download on page #387


-
16
-
 2
2
-
-
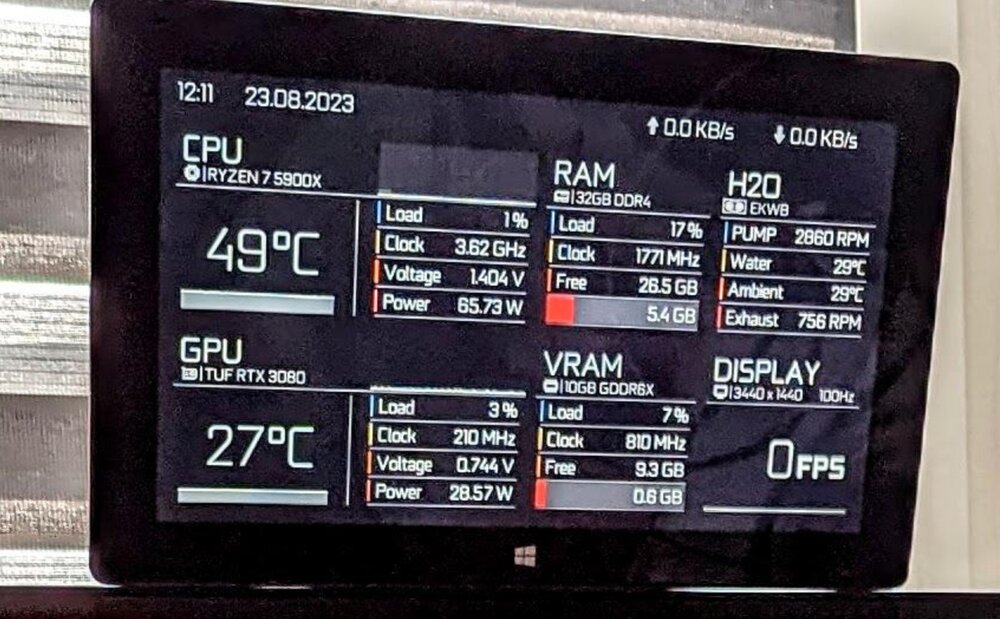
On 4/20/2023 at 7:08 AM, WINTERMUTE said:
My panel
Nice to see my SensorPanel in action and working as it should.
-
1
-
-
12 hours ago, MrGene said:
WHere can this be downloaded from as it is not on page 391. I looked
For some reason my original post got moved to page #390, so look there.
-
On 3/10/2023 at 6:08 AM, r10 said:
This is literally the easiest thing to implement... and the only thing preventing me from using AIDA64 instead of HWINFO.
Why the reluctance? People have been asking for this since 2016 and it would be easier than telling people "It's not possible for the SensorPanel, but you can have that data either logged into a HTML or CSV log file".
Pseudo code... excluding UI Min/Max/Avg selector.
# Initialize variables to store min and max sensor
min_sensor = 1
max_sensor = 1# Read from sensor
current_sensor = read_sensor()# Check if current sensor is lower than current min
if current_sensor < min_sensor:
min_sensor = current_sensor# Check if current sensor is higher than current max
if current_sensor > max_sensor:
max_sensor = current_sensorThis needs to happen. I love using AIDA64, but without this simple option and few more bits is incomplete.
It's been a while since they added any new features. -
1 hour ago, cyantist said:
Here's mine based on VeilSide's original work. I originally wanted it to be a little flashier, but the minimalist look is kinda growing on me for now. Thanks again.
Looks amazing! So clean.
-
6 hours ago, JariKoi said:
Here we go again! Today I quickly edited this panel to suit me. Thanks to original designer @ThatManOnTheMoon and @VeilSide. Panel size is 515x1920


minimalistic_515x1920.sensorpanel 101.94 kB · 14 downloads
minimalistic_515x1920_black.sensorpanel 168.07 kB · 13 downloads minimalistic_515x1920_white.sensorpanel 167.7 kB · 12 downloads
Lovely to see more color and panel size designs of my project, great job!
-
1
-
-
My 1920 x 480 minimalistic sensorpanel is now available for download on page #388.

-
7
-
-
On 3/9/2023 at 9:06 AM, Kryogenus said:
Hi VeilSide
Very nice panel.
Is it possible to share it?
Thanks a lot.Thanks, It's still WIP. This is just a Photoshop render. Keep an eye out for it on Page #388.
-
Working on 1920 x 480 version of my minimalistic sensorpanel.

-
6
-
-
10 hours ago, stan137 said:
I'd love to have this on 480x1920. I'd happily pay someone for it.
It's doable. I'll try to make a template in PS.
-
1 hour ago, Onours said:
Hey veilside, unless he is your self or don't your consent the aliex seller is distributing his screens with your designs
https://a.aliexpress.com/_EzgZUVx
They are from AliExpress indeed. I bought an LCD display from one of them shops. All these sensorpanels were included.
-
1
-
-
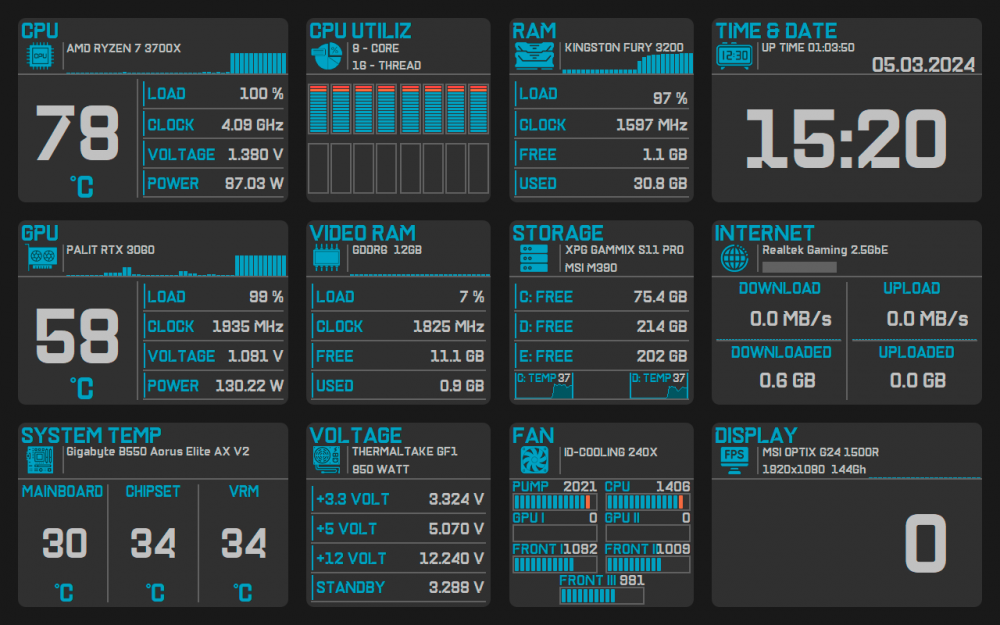
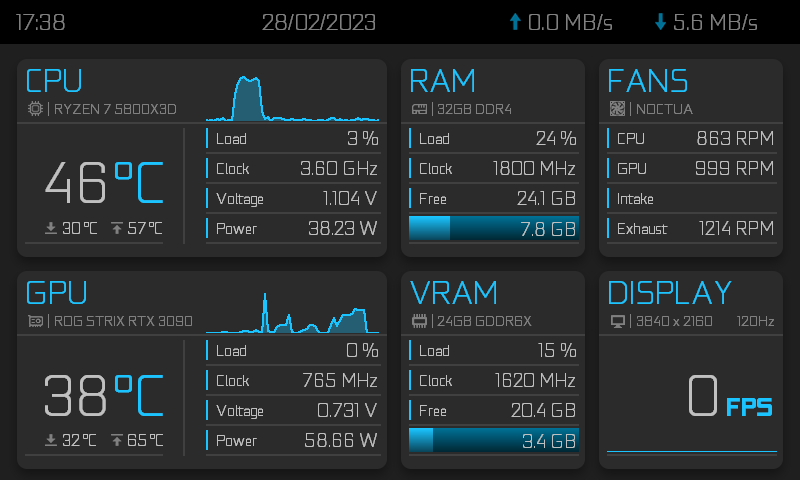
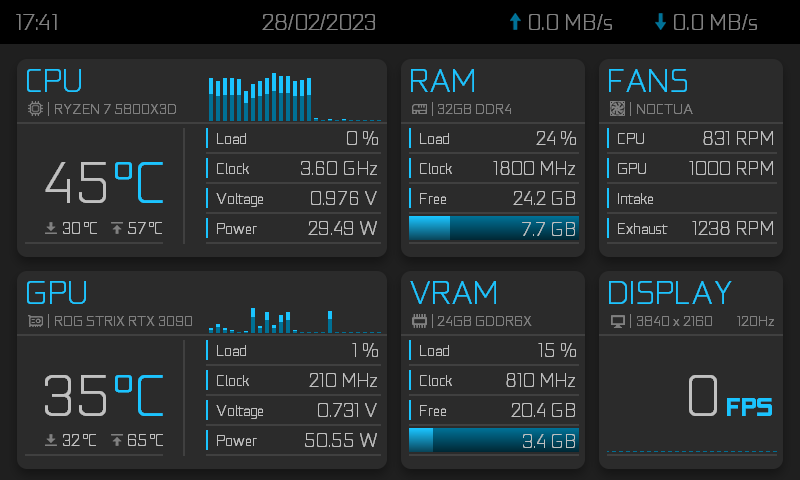
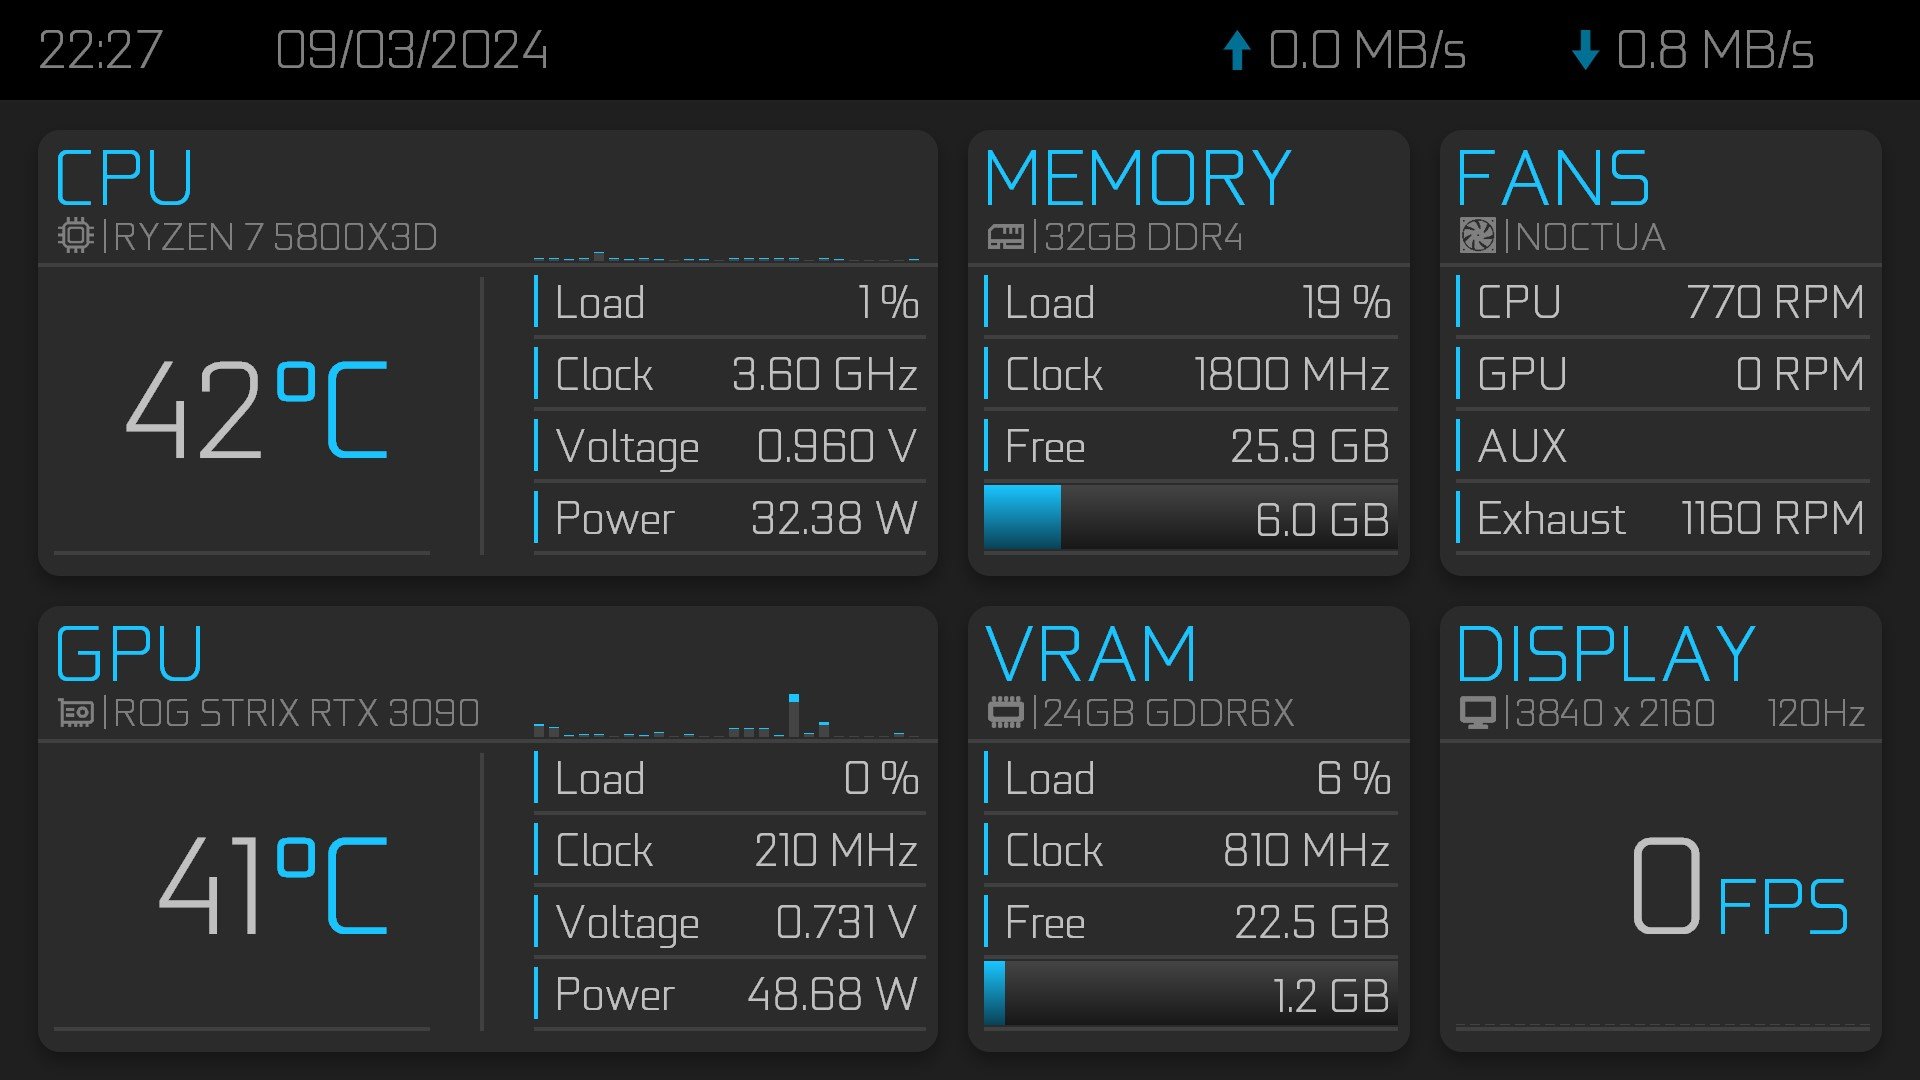
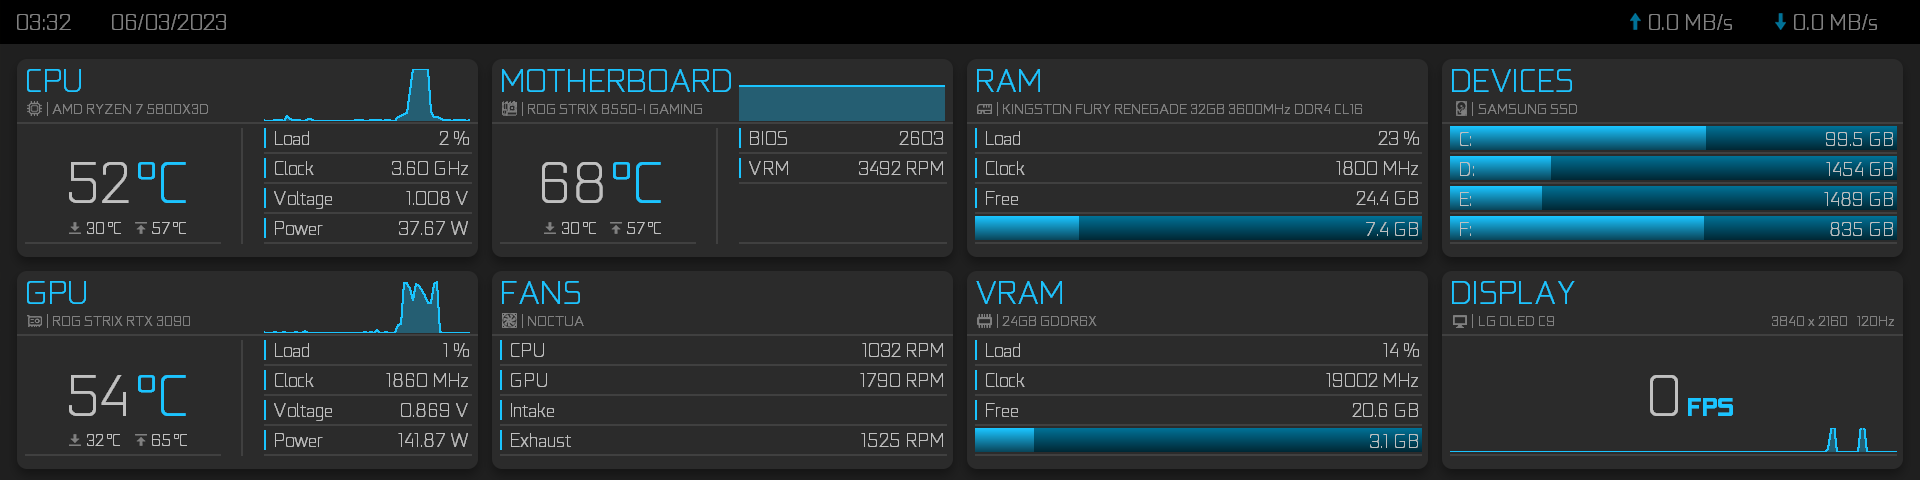
My updated 800 x 480 minimalistic and newly added 1920 x 1080 minimalistic as well as 1920 x 480 minimalistic version sensorpanel inspired by @ThatManOnTheMoon designs.
Histograms are now added within the same SensorPanel Manager.
Note: CPU and GPU min/max temperature readings are just static labels/placeholders since those features are still not available. They can be hidden in SensorPanel Manager. Intake fan speed is also disabled since I have my intake fans connected to external fan headers on the GPU and as of today, there is no way to monitor them with AIDA64. If needed, link it to whatever fans you like and enable the option.
Alternate version with histograms.
1920 x 480 version

Make sure to download and install GeForce font if you haven't already. geforce_light.otf
minimalistic_800_480.sensorpanel minimalistic_1920_1080.sensorpanel minimalistic_1920_480.sensorpanel
To enable histograms for CPU/GPU/RTSS do the following in the SensorPanel Manager:
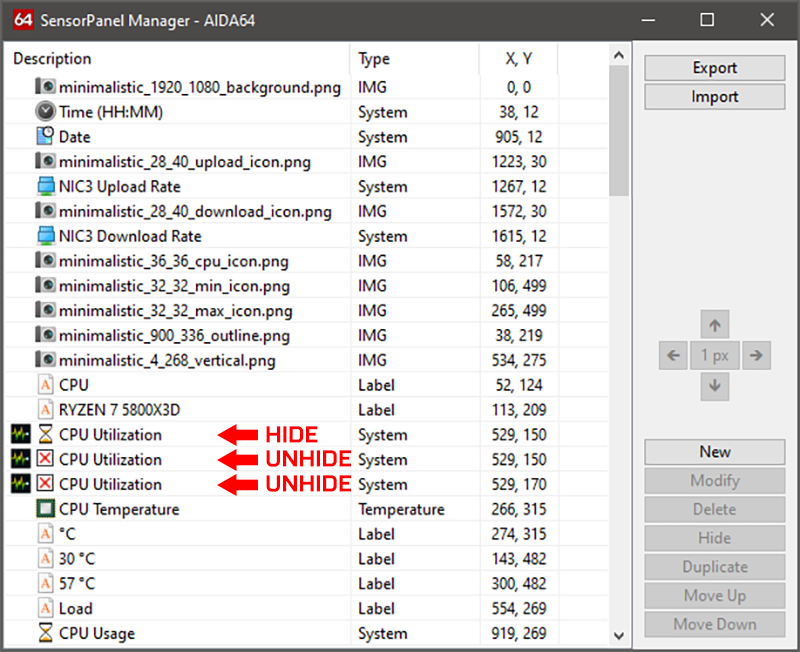
Changelog:
03/03/2023 Added drop shadow effect for the overlay, fixed some text overlapping.
12/03/2023 Added 1920 x 480 minimalistic sensorpanel version.
-
14
-
4
-
-
49 minutes ago, Kryogenus said:
Hi VeilSide
Many thanks for all your panels.
They are very beautiful. good work.Thanks, but I didn't make or test any of these. I got them for free when bought a 6.6" display. Just sharing, maybe someone make use of them.


Option to ignore DPI scaling for SensorPanel
in Brainstorming
Posted
I am aware of this "fix". Although it fixes the scaling problem, it introduces another. Display size will be shown incorrect.