All Activity
- Past hour
-
 Letmebe joined the community
 - Today
-
 kone joined the community
 -
 rivin joined the community
 -
It's ongoing, for existing customers. If you guys aren't able to participate in this campaign, then let me know and I'll take care of you in private messages.
-
 98win07 joined the community
 -
 gnuthnahtneyugn joined the community
 -
 baiano joined the community
 -
 luckyworld1phh joined the community
 -
 98win70 joined the community
 -
 Toppoff joined the community
 -
 Sub200 changed their profile photo
 -
 Makyuri changed their profile photo
 -
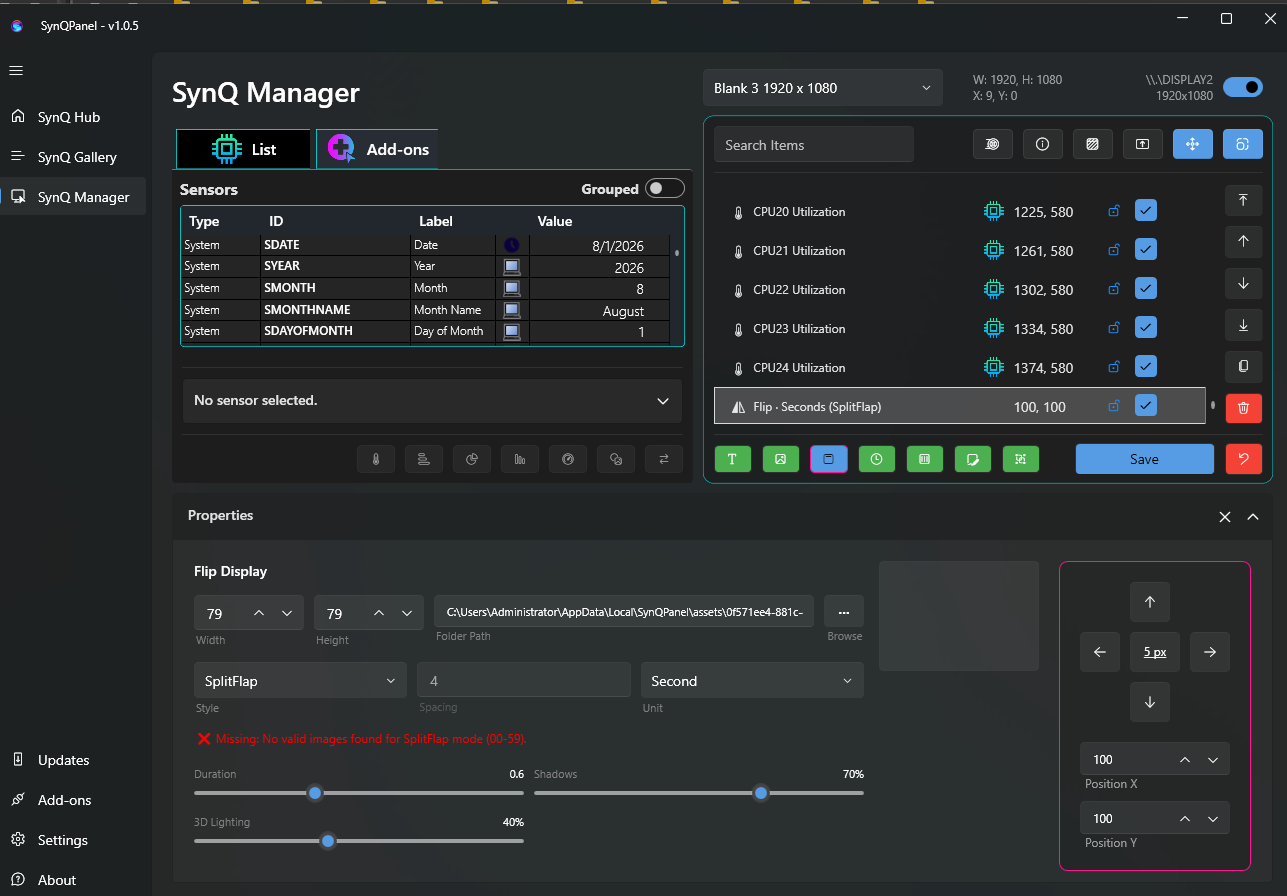
is there a way to rotate everything you resize?
-
 jack5577 joined the community
 - Yesterday
-
Does anyone have flip panel for the 12 months Day and Year and Sun-Sat that they could share in a zip file. Thanks
-
When is the sale? 🙂
-
 Please check your inbox. Keep the numbers name same as 0 to 9 only! Direct/browse to this folder and you will have the working flip clock easily!
 -
That's true, I think its one of the car brands I've never owned. On a side note, what program do people use to give there plain gauges a little bit of a colour pop?
-
 Anyone have a zip file with Flip Numbers they could send me. Lifterjack@yahoo.com
 - Last week
-
 Go to Flip clock Images - Free Download on Magnific (formerly Freepik)
 -
Notice in red I did select folder and that is what the response was. I must be missing a step.
-
You need to select your folder for 0 to 9 images. SynQPanel will automatically make it 00 to 59
-
Where can I find the Images 0-59 for the flip panel. I looked in Local in assets nothing there or in program (86). When in manager Trying to create it . Says no images and the location it is trying to go to I do not have that asset number
-
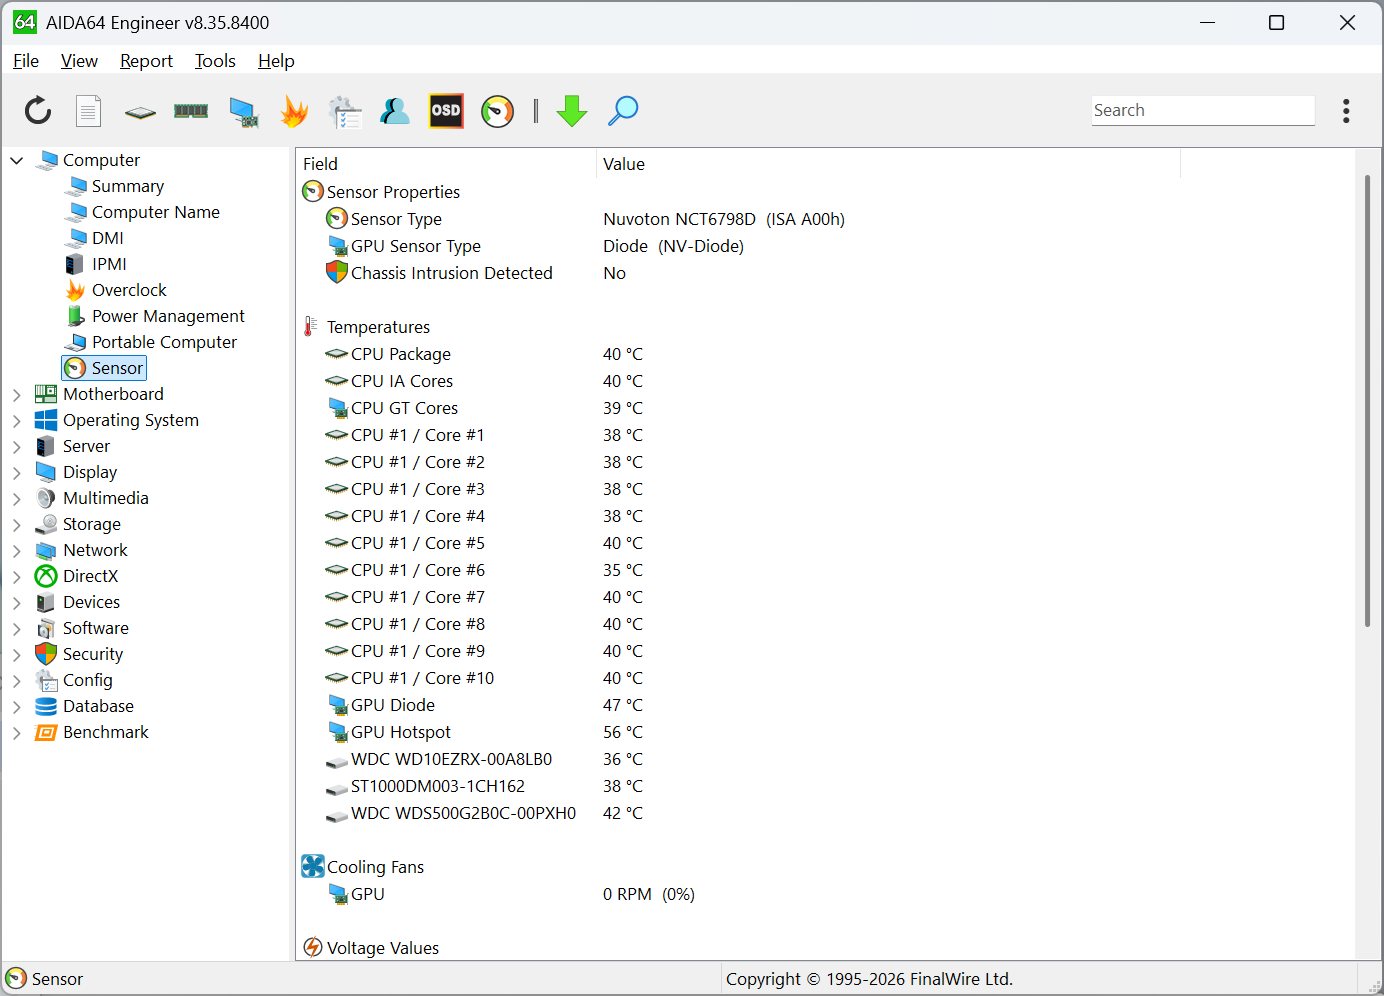
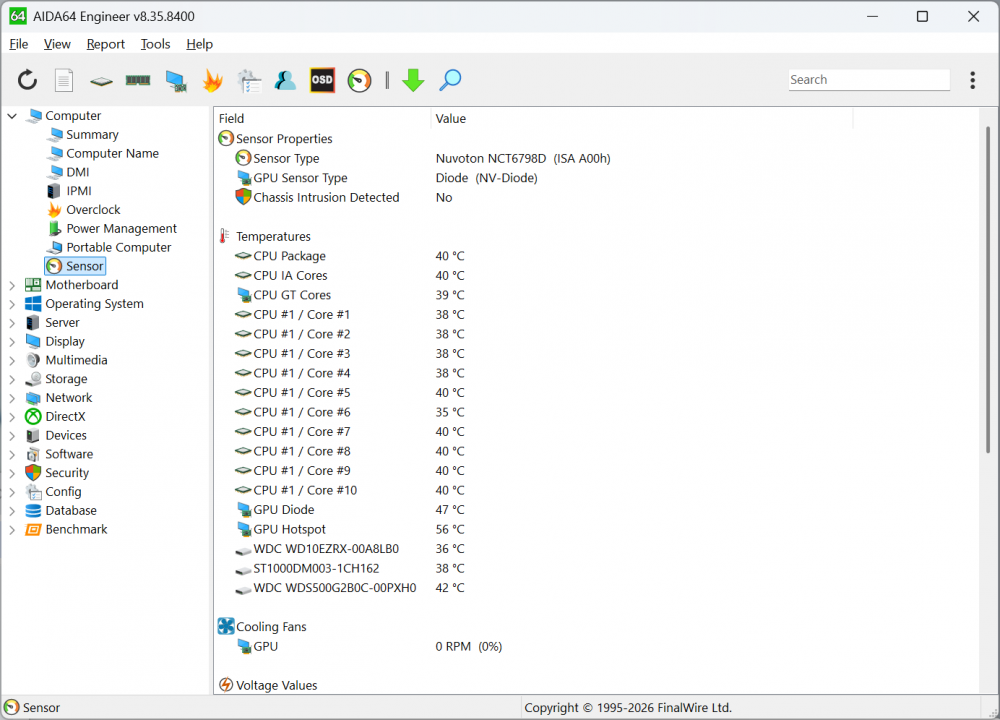
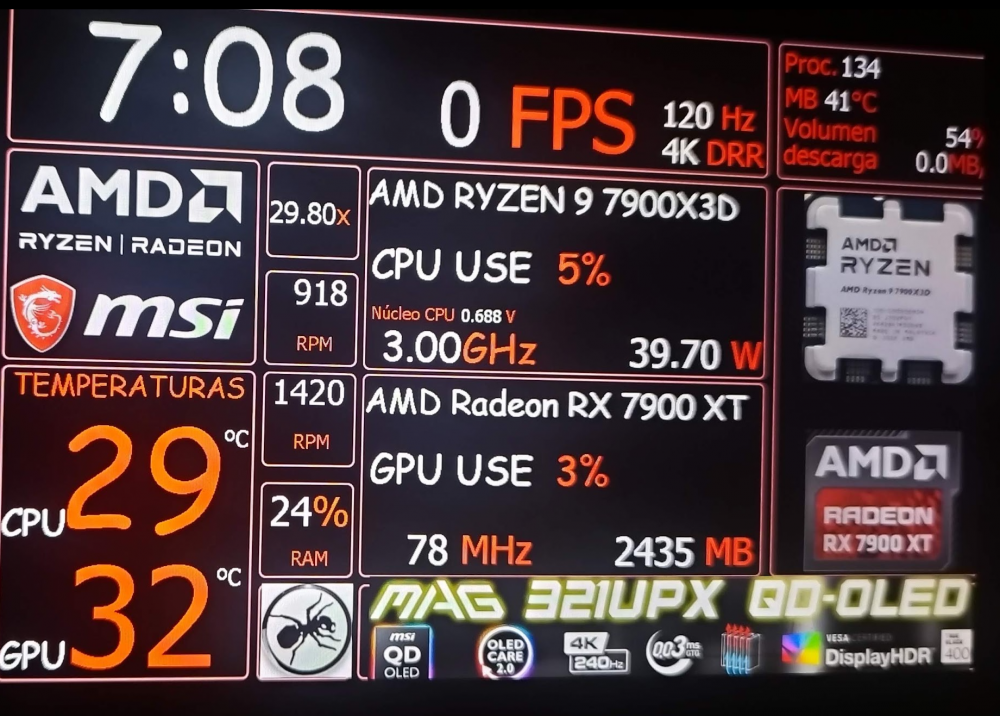
Hello AIDA64 doesn't show the CPU/MB temperatures and the CPU/Chassis Fan speeds 🤔
-
Besides, who willingly pays for a BMW anyway? 😅🍻
-
Wrong thread! This forum thread is called "Share your Sensorpanels", not: give me money and i do the job and change the resolution. There is a specific sub-forum for stuff like this, if you want to sell your sensorpanels. Use at least the PM function in this forum.
-
hola, he creado este sensor panel, si gusta echarme una mano y creare mas https://www.etsy.com/shop/franprodigystore/?etsrc=sdt&coupon=SAVE25&utm_medium=social_organic&utm_source=pinterest&utm_campaign=scoupons_coupon&epik=dj0yJnU9TmJEZDNFZERhUzZpWW5OV1NVU1dCdUoyT0VYd0hWNGYmcD0wJm49alB2bDdscmEtTF9sWjIyY0tiV2k0QSZ0PUFBQUFBR3BybUZB
-
WRONG FORUM THREAD!
-
Trying to enter my aida64 business serial number and it says its been blacklisted! Whats going on?
-
why is the scale function not available on stable version but on beta's? Would like it to be always available.
-
- 1
-

-
 I’m building a personal, normal-user Windows hardware-status application for an ASUS ROG RYUJIN II, USB VID 0B05 / PID 1988, with its 320×240 display. I’d prefer to keep AIDA64 as the sole display owner. My application would publish telemetry through the documented registry interface: HKEY_CURRENT_USER\Software\FinalWire\AIDA64\ImportValues using Str1–Str10 and DW1–DW10. I would configure the LCD layout once in AIDA64, then let AIDA64 automatically render updated values to the RYUJIN. Could you please confirm: Does the ROG RYUJIN II LCD module support a fully customized LCD Items layout containing imported registry values, or is it limited to the four ROG preset layouts? Can that layout use a static background image plus dynamic text, gauges, and state images bound to ImportValues? Will AIDA64 automatically refresh the RYUJIN when those registry values change, without reapplying the layout? Are ROG LCD updates through ROGAIOSDK.dll volatile buffer updates, with no image/profile/flash-storage writes? Is Armoury Crate display control simply required to remain OFF while AIDA64 owns the LCD? What refresh interval do you recommend for this device? I intend to use no more than 1 update per second and suppress unchanged values. Does normal ROG LCD operation require administrator rights or any AIDA64 feature beyond an ordinary AIDA64 Extreme license? My application will not access the cooler HID interface or expose pump, fan, firmware, lighting, or other control operations. If imported values are not supported by the ROG LCD module, is there an officially supported way for a personal third-party application to use the display-only ROGAIOSDK.dll buffer API without redistributing the DLL?
 -
Hotspot temperature for RTX 5000 Series has been implemented in AIDA64 v8.35: https://www.aida64.com/downloads/latesta64xe We'll work on VRAM chip temperature readings in August.
-
 celineclara changed their profile photo
 -

Any plans to support Thermalright TROFEO VISION 9.16 LCD?
irfanor replied to Schakal's topic in General Discussion
Version: 8.35.8400 stable (Jul 28, 2026) MD5: 8939e88020eff7bbee7b1c14f27d0f12 Release notes: Improved support for AMD Zen 6 based CPUs and APUs Preliminary support for AMD Mustang Peak CPU Preliminary support for Intel Panther Lake-R CPU Thermalright Trofeo Vision 9.16 LCD support Turing (Turzx) 2.8-inch LCD support Waveshare LCD support GPU details for AMD Radeon RX 6300 GPU details for nVIDIA RTX Spark N1X USB-NVMe passthrough support for Asus ROG Strix Aiolos Fixed: crash in the OpenCL layer Fixed: handle leak in ROG AIO LCD module Its does support Trofeo 9.1 LCD but only *trlcd files. *.sensorpanel & *.spzip arn't working on it.... -
 Marc Vinn changed their profile photo
 -
 JoDaMedina changed their profile photo
 -
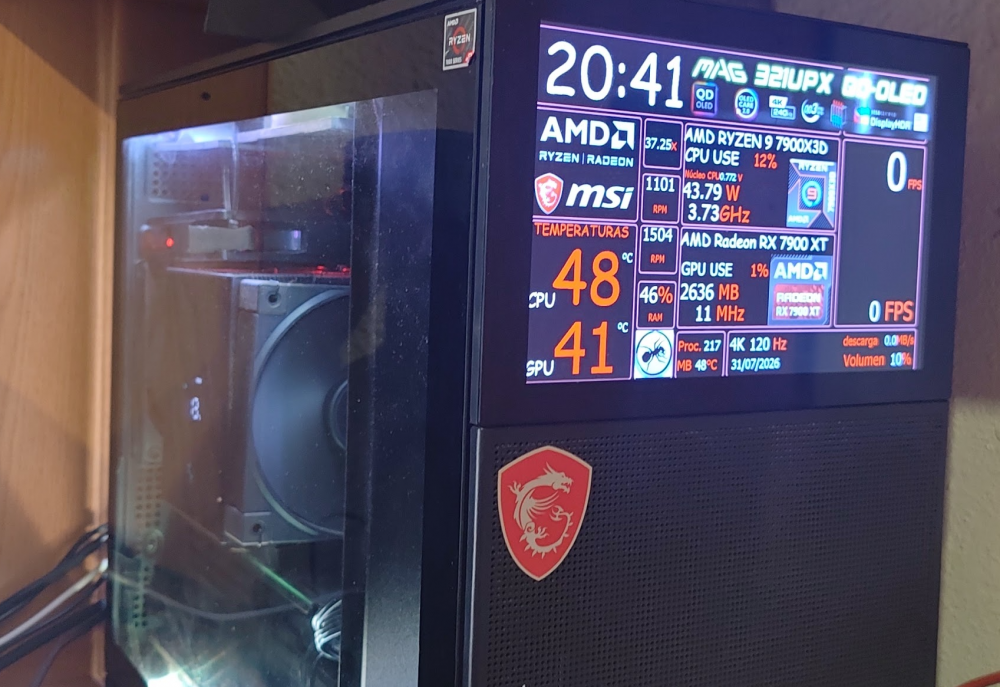
This is a copy of the speedometer from the BMW i4, modified to display sensors.
-
i think i might be in love... i love the graphics for the sensors left and right...
-
RTX5080