rinaldop
Members-
Posts
642 -
Joined
-
Last visited
-
Days Won
24
Content Type
Profiles
Forums
Events
Everything posted by rinaldop
-
I found a few in this search https://forums.aida64.com/search/?q="2560x1440"&quick=1&type=forums_topic&item=13296
-
Try this Scaling issues? I import a sensorpanel and its changes the size and re-aranged objects How to avoid scaling problems with sensor panels? Two things usually cause that You do not have the proper font installed. (The default font is loaded instead) You do not have Windows scaling set to 100% A: When creating a sensor panel, make sure that you set the scaling in Windows to 100% and that the resolution in Aida64 is correct. The manually set sensor panel dimensions are saved directly in the sensor panel file and are automatically applied when loading for the first time. How to check the panel size? Right click on "Aida64" Task bar Icon > Settings > SensorPanel > SensorPanel Size Scaling issues? (Windows) Fix: Try setting "DPI compatibility mode" for aida64.exe It's a Windows compatibility setting that you apply on the EXE itself. Locate AIDA64.EXE (C:\Program Files (x86)\FinalWire\AIDA64 Extreme) aida64.exe > properties > compatibility > change high DPI settings > activate "Override high DPI Scaling behavior" to System. Scaling performed by: 'System' (from the drop down) > Ok/Apply > Restart Windows > Load/import panel and check if it works now. Once you've done this, make sure that your SensorPanel properties are set to match the new panel before importing and you have a better chance of being successful. Troubleshooting not working? Users who have this scaling problem and cannot resolve the error with the known "fixes" unfortunately have to manually re-align each individual object.
-
Go to C:\Program Files (x86)\FinalWire\AIDA64 Extreme Right click Aida64.exe then click on the Compatibility tab, click Run this program as an administrator then click Apply.
-
Here are several https://forums.aida64.com/search/?q=1080*1920 &quick=1&type=forums_topic&item=13296
-
Here https://forums.aida64.com/search/?q="600x1024"&quick=1&type=forums_topic&nodes=28
-
Just look at the upper right corner of the page and find the search field and type in the size you want like this https://forums.aida64.com/search/?q=515x1920&quick=1&type=forums_topic&item=13296 It always surprises me that people don't see that, I found it my second time here
-
So, I wanted to praise all of the new panel designers posting lately on this almost dead forum and I got this warning: "Sorry, you cannot add any more reactions today." Hilarious!
-
I can't tell what that screen is or if it is not recognized but here are panels using that size, try them. https://forums.aida64.com/search/?q="1920x1080"&quick=1&type=forums_topic&item=13296
-
This is unavailable, MODs do you need to approve it?
-
Wow, a free competitor to Aida64? Looks great and can use HWiNFO data so I can display my Corsair fans something Aida64 still cannot do after years of trying? Interesting.
-
For you, the greatest panel ever made
-
Try this https://forums.aida64.com/search/?q=1280x800&quick=1&type=forums_topic&item=13296
-
What franchise is that?
-
I love it!
-
I am doing well thank you! Still waiting for this great program.
-
Any idea when it will be released?
-
Very interesting!
-
Well, there is my masterpiece Then there are these: https://forums.aida64.com/search/?q=hyte&quick=1&type=forums_topic&item=13296
-
Thanks! I am glad that you like it! I am also happy that the resolution worked well for you !
-
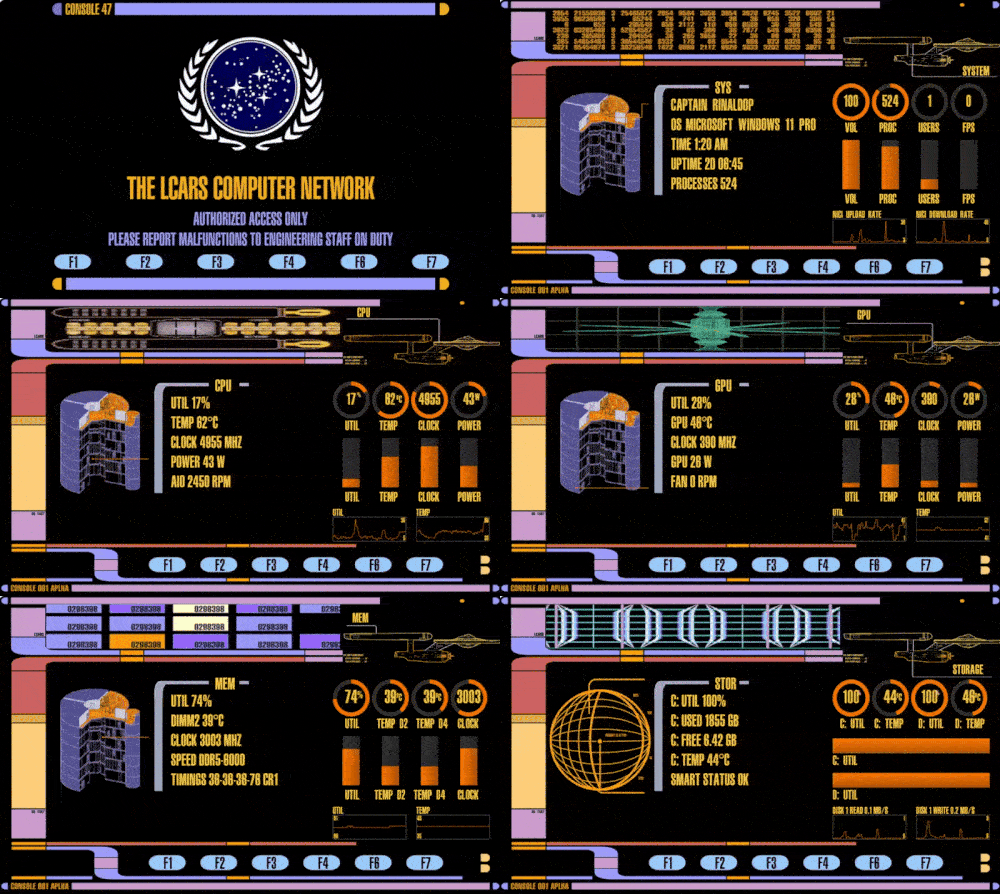
Rejoice Star Trek lovers! The LCARS THEME GOD SCREEN returns this time in horizontal mode! Here is my forth panel for Star Trek fans. This is by far the most complex panel ever posted on this forum because it is actually SIX panels in one! Each panel is dedicated to a specific system, SYSTEM, CPU, GPU, MEM, and STORAGE. Each panel is accessed by using the function keys F1, F2, F3, F4, F6, F7 (F5 is saved for screen refresh) Unfortunately Aida64 does not support touch screen but if you overlay touch screen software with a transparent background and get it to provide function key use there are buttons on the bottom of the panels that can be made functional. You can also have the pages change automatically on a timed basis in the LCD Options section. Not only is this panel loaded all of the useful computer data you need but it is also loaded with a ton of graphics giving the user the full immersion effect of being on the bridge of the Enterprise, NCC-1701 To achieve the multi panel effect I had to rely on the .rslcd format which means it must be viewed in a browser. Simply active LCD support by going to AIDA64/main menu /File /Preferences/Hardware Monitoring/LCD, set the resolution to 1024x600, click the check box to Enable RemoteSensorLCD support, and set background color to black. Then display the browser in your screen. Alternately you can use this third party .rslcd viewing program and display it on your screen. That program here: https://forums.aida64.com/topic/13419-aida64-viewer-for-displaying-rslcd-sensor-panels/#comment-57603 The panel resolution is 1024x600. The font is LCARSGTJ3 and is included. I hope you like it! Be sure to like, comment, and be sure to smash that notification bell! (oops, wrong website The graphics in this panel made the file size over 8 MB so the file is on my cloud storage https://drive.google.com/file/d/1TR6pSXVflgtv0tkDfsF-WFcOK7alaw9n/view?usp=sharing
-
I finally found the time to finish the horizontal version . I did it in 1024x600 but if you need it in 1600x1200 I will resize it again
-
Here are several https://forums.aida64.com/search/?q="1280x400"&quick=1&type=forums_topic&item=13296
-
Very nice, sure post them here!


