


Fiery
-
Posts
12171 -
Joined
-
Last visited
-
Days Won
535
Content Type
Profiles
Forums
Events
Posts posted by Fiery
-
-
Are you sure you use AIDA64 Business Edition? Please note that AIDA64 Extreme Edition doesn't support command-line based automation, hence it ignores any command-line arguments.
Regards,
Fiery
-
We've asked Intel to get the necessary programming details, but they didn't provide anything useful I'm afraid

-
When i run Starcraft 2 on my pc, and i launch AIDA afer playing, it tells me also CPU OVERHEATING.
Does that mean i should stop playing Starcraft or do you think the computer can handle it ? (i can tell by putting my hand next to the fan that there's a good airflow, even if it's slightly (or fairly) hot...)
In that case I'd bring the computer back to the shop for diagnosis. While playing a game the system should definitely not overheat.
-
I'm not sure why you want to buy new memory modules. If your memory is running at 667 MHz, then it is running at factory default (normal) settings for a DDR3-1333 module.
As for the overheating, some of the mobile computers may be designed in a sub-par way that even when everything is clean and brand new, the system can still not stand a heavy stress test without overheating. Usually your system is not under such heavy demand workloads, so the overheating most likely wouldn't come up while running regular everyday tasks. AIDA64 System Stability Test puts the "absolutely worst case scenario" on the computer.
-
1) It means your CPU is overheating. You should stop the test and check the exhaust ports of your notebook -- maybe they're clogged up with dust that prevents hot air from escaping from your notebook's inside.
2) DDR3-1333 memory is running at 667 MHz real clock.
Regards,
Fiery
-
Thank you, we'll work on those. However, please note that some SSD drives may be reported as unknown HDDs, that's normal. And with those cases when the model ID is not fully available ("SSDSC2CW18" instead of "SSDSC2CW180A3"), AIDA64 hardware database may not be able to provide a record.
BTW, do you have official specifications on the Velociraptor drive? (WD1600HLFS)
Regards,
Fiery
-
As far as we know, CPU package power can only be measured on Sandy Bridge and newer Intel Core processors. On your Nehalem-class CPU the reading is not available.
Regards,
Fiery
-
So what about direct access to the uploaded benchmark data? Would that be possible? Thanks!
As I've stated above: "We don't yet have an online database for benchmark results." It's still the case

-
I have an Asrock Z77 Extreme4 and my PCH Diode has never changed once from 43C. That doesn't seem correct. Not even one degree up or down.
Have you tried the latest beta version of AIDA64 Extreme Edition? It's available for download at:
http://www.aida64.com/downloads/aida64extremebuild2256z8l9qktcjyzip
After upgrading to this new version, make sure to restart Windows to finalize the upgrade.
If it's still stuck, then your motherboard may not be able to measure PCH temperature.
-
Yes, overvoltage (or unstable voltage delivery) and fan issues can also trigger the BIOS to shut the machine down.
-
Core temperatures are zero when the ACC (Advanced Clock Calibration) feature of AMD processors is activated. ACC is used to unlock disabled CPU cores. This is a hardware limitation that cannot be fixed from software.
Regards,
Fiery
-
Is it only missing from the SensorPanel? Is it still there on the Computer / Sensor page?
BTW, what video card(s) do you have?
Thanks,
Fiery
-
1) Please right-click on the bottom status bar of AIDA64 main window --> Sensor Debug --> ISA Sensor Dump. Copy-paste the full results into this topic.
2) Then right-click on the bottom status bar of AIDA64 main window --> Sensor Debug --> Embedded Controller Dump. Copy-paste the full results into this topic.
Thanks,
Fiery
-
Graphical artifacts and sudden power-off are both critical issues that reflect the instability of your system at the settings you used. A sudden power-off is usually due to overheating: the BIOS senses one of the components (usually either the motherboard or the CPU) is too hot, and it powers the system off to prevent fatal hardware damages.
-
Thank you, got the email. Please provide us a few days to diagnose this issue. I'll post updates about this matter in this topic
-
It is the file called AIDA_VSB.VSB that you can find in AIDA64 installation folder. Try to rename it to AIDA64.gadget and copy it to your gadgets folder, and see if it works that way. However, please note that AIDA64 itself will try to install the gadget as soon as you enable Desktop Gadget support in AIDA64 / main menu / File / Preferences / Hardware Monitoring / Desktop Gadget.
Regards,
Fiery
-
If you get an error message in the AIDA64 System Stability Test, then your system is not stable
We usually recommend to run the test for at least a few hours to make sure all your system components are heated up to their maximum temperature.Regards,
Fiery
-
Please right-click on the bottom status bar of AIDA64 main window --> Sensor Debug --> ISA Sensor Dump. Copy-paste the full results into this topic.
BTW, does the CPU temperature reading look alright in the BIOS Setup?
Thanks,
Fiery
-
That's normal. Intel wrote to us:
Execution units - each EU is SIMD 4 capable – so effectively 6 EUs is more like 24 “shadersâ€/â€processors†that other IHV’s are using to count their archituectureTo make things more consistent across different GPU vendors, we've decided to go for the number of shaders instead of the number of EUs.
Regards,
Fiery
-
I'm sorry, but ... AIDA64 is written in Delphi? Maybe, there is possibility to transfer the image of SP using TSocket?
For example, this will allow to view the SP remotely on a PDA or tabletPC.
I'm afraid we currently have no plans to extend SensorPanel in that way.
-
1) Do you mean the temperature reading labelled as "CPU" is always 40 Celsius, no matter if the system is under load or at idle?
2) Do you have Asus AI Suite installed?
3) Do you have any other hardware monitoring, tweaking or overclocking application running in the background?
Thanks,
Fiery
-
Is there any progress in getting aida64 to recognize my bios?
I have updated my bios to 6.40 and the newest beta of aida64 and it still does not recognize the bios and I must still have OSD on in order for aida64 to be stable most of the time it is running. It has it's periods of sluggishness then returning to responsive.
AIDA64 CPU still has issues filling in the form data. It will become extremely slow while trying to fill in the data of the mother board section. It will list the motherboard name after a few minutes, but will not fill in any more data, and while it is in that state, cpu speed will fluctuate in the aida64 cpuid window. it will go from 1.6GHz to 3.4, and the cpu usage is terribly high and temps skyrocket during those times, and the cpu fan kicks on maximum and pushes out very hot air. The program will not crash until I click the close button. If I do not close AIDA64 CPUID, it will continue to to make the cpu clocks rise and fall and temps rise and fall.
Why is it taking so long to get this issue resolved?
I'm sorry for the delays. I've just sent you a private message about this issue.
-
Great.
Works just fine.
Thank you so much.
Thank you for the feedback
-
Fiery
For 3D-programs in full screen (games, tests, etc) I use external self-made LCD, which connected to PC via USB.
PC "see" him as a simple serial port (not VGA-monitor).
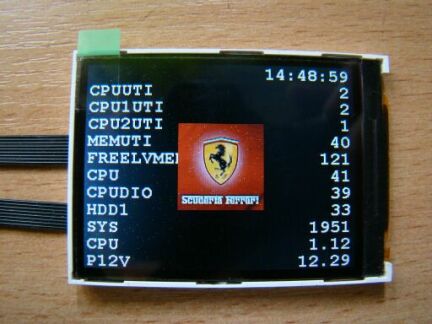
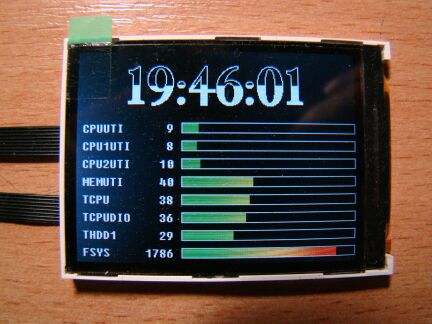
For data transfer i use my plug-in, but his functional very poor versus SensorPanel (screen)
Question : can AIDA64 transfer an image of SP into a shared memory ? Then i take it from this memory and transmit further, to the my LCD.
Thanx.
(sorry, it's Google translated)
I'm afraid AIDA64 cannot expose or export SensorPanel images in any ways.
Aida-Batch-Start is ignoring arguments
in Network audit, change tracking, SQL databases
Posted
Make sure to disable any other methods of auto-launching AIDA64 at Windows startup. AIDA64 itself supports that (in main menu / File / Preferences / General / Load AIDA64 at Windows startup); and then there's Windows Task Scheduler. Maybe multiple methods are active, and they interfere with each other.