


Fiery
-
Posts
12632 -
Joined
-
Last visited
-
Days Won
567
Content Type
Profiles
Forums
Events
Posts posted by Fiery
-
-
10 minutes ago, tistou77 said:
If this voltage isn't present in the UEFI BIOS, does that mean it can't be "properly read" ?
In general, no, that's not the case.
-
3 minutes ago, tistou77 said:
I don't have the VBat voltage in the UEFI BIOS (or I have never seen it)
Thank you! It may mean the standard VBAT register in your sensor chip is not actually relevant for VBAT measurement.
-
On 6/17/2026 at 9:14 AM, Packovics said:
Hi Fiery,
I would like to request hardware monitoring support for the new Zalman ZM-MF916 sensor panel display.
It is a 9.16-inch ultra-wide LCD display (1920x462 resolution) that connects internally via a 9-pin USB 2.0 motherboard header (or externally via a USB Type-A adapter) and uses proprietary software to push widgets and system info. It does not appear as a standard Windows monitor extension.
As requested, I have generated and attached the USB dump from AIDA64.
Please let me know if you need any further testing, logs, or information to implement support for this device in future beta builds.
Thanks in advance for your awesome work!
Best regards,
Packovics
We've ordered a device and will start working on it as soon as it arrives in our labs.
-
 1
1
-
-
On 6/19/2026 at 1:27 AM, AlphaGator said:
Hello, it looks like the Lian Li 8.8" screen is not listed/supported. Is there any workaround as LCD, or do I need to use SensorPanel? Is there anything I can do to help support getting the LCD added?
That screen should work as a regular monitor too, in which mode you can use the SensorPanel facility with it.
-
19 hours ago, tistou77 said:
When I tested the new battery, the multimeter showed 3.23v (or 3.27v, I don't recall exactly).
In Aida64, it shows 3.16v, if it helpsThank you. We've double-checked it, and according to the information available to us, AIDA64 uses the right sensor register to measure VBAT voltage. Did you see the VBAT voltage drop to under 1 Volt in the UEFI Setup?
-
2 hours ago, Niff said:
Good evening, I have been keeping an eye on Facebook hoping for a new sale, but I have not had any luck catching one. Could I expect one within the next month or what sort of timetable might I be looking at?
Yes, we're looking at a summer sale around late next month or early August.
-
16 hours ago, POE said:
Trying to fit a 1920x482 image on the screen doesnt seem to center correctly, the top and bottom are off by a few pixels
Any updates on when thermalright 9.16" will be supported fully in AIDA64 Business?
Thanks
Paul.
It will be supported by the next stable update of AIDA64 Business due next month.
-
1
-
-
2 hours ago, tistou77 said:
That's not the case, I did several tests, and it clearly indicated 3.12v for the faulty battery (~0.76v on the multimeter)
The new battery fluctuates between 3.16 and 3.18vIt means AIDA64 may use an incorrect sensor register to measure VBAT. Can you make test runs with both a depleted and a good battery?
-
1 minute ago, tistou77 said:
Asus Rampage VI Extreme Encore (X299)
On that motherboard VBAT monitoring should work accurately.
-
15 hours ago, tistou77 said:
Hello
Can Aida64 correctly read the battery voltage ?
My PC was having trouble saving BIOS settings, Aida64 showed a battery voltage of 3.12v
I removed the battery, and the multimeter showed 0.76vThanks
It should be able. What motherboard do you have?
-
15 hours ago, POE said:
Would i have to buy a new licence?
I was planning on getting the business version.
If you have no existing AIDA64 license, then you need a new license.
-
On 6/21/2026 at 11:25 PM, POE said:
Is it possible to startup AIDA64 by manually creating a task scheduler task and then setting that task to startup as "hidden" which removes the icons in the system tray?
basically making a "run on demand" task
Cheers
You can do that with AIDA64 Business, AIDA64 Engineer and AIDA64 Network Audit using the /SILENT command-line option.
You may also like the following guide about command-line automation offered by our business products:
https://www.aida64.com/news/aida64-command-line-builder-tool
-
1
-
-
On 6/22/2026 at 4:43 AM, POE said:
I'm waiting for full support of the Thermalright 9.16" lcd screen to be out of BETA, if i buy AIDA64 now would i be able to update it when support arrives?
Many thanks
Yes, of course.
-
1
-
-
10 hours ago, NjnaGrimsdottir said:
I'm coming back to the tool after a few years away and would love to renew the sub, but it's tied to my old email address and the price is so high for a new user... if I use my old address I can get 30% off, but I really don't want to do that as I've legally changed my name and am trying to discontinue using that old address whenever possible? Anyone know of a code to get it for cheaper or like a lifetime sub code discount or something?
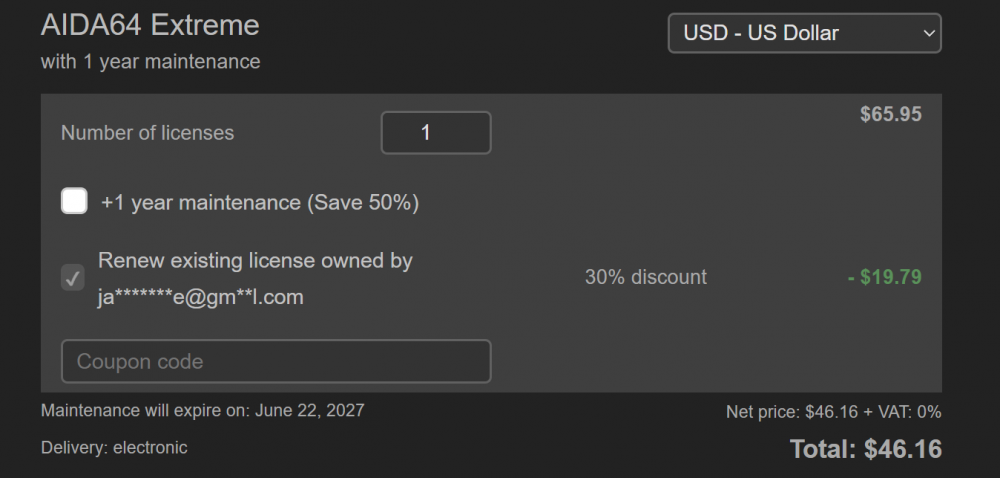
I've sent you a private message about this issue.
-
11 hours ago, Alexander_A said:
In GPGPU test Ryzen 8700G shows:
Memory Read GPU 38280 Mb/s - CPU 63740 Mb/s
Memory Write GPU 36536 Mb/s - CPU 88447 Mb/s
Memory Copy GPU 75385 Mb/s - CPU 74036 Mb/s
So it can not be true because GPU and CPU have same memory controller. Interesting that hwinfo64 shows same values when GPGPU test running, but in LLM inference with gpu only i see full memory read speed (about 64GB/sec).
Same situation on Ryzen 9950X when you testing iGPU.It can be true since the GPU column lists the memory bandwidth that the iGPU can actually utilize through OpenCL. While the CPU column lists the full data path available for the CPU without the overhead of OpenCL and the overhead of the CPU-iGPU connection.
-
13 hours ago, Liquid3d said:
It is working correctly now Thank You
Thank you for your feedback!
-
21 hours ago, Han_Comandante said:
Hi, i can only see battery temperature, nothing else in that section. Is this normal, or can I fix it?
Thank you for your feedback. Please note that ever since Android 7.0 (for whatever reason) Google decided to block apps from accessing several system files that were previously readable. That includes the files apps would need to show thermal sensor readings. Battery temperature reading is still available fortunately.
-
18 hours ago, Liquid3d said:
As the title states I can not see the per pin GPU current on this card.
I do have the latest Beta installed.ROG-ASTRAL-RTX5090-O32G-BTF-GAMING
nvidiasmbusdump.txt nvidiagpureg.txtThank you! Make sure to upgrade to the latest beta version of AIDA64 Extreme available at:
https://www.aida64.com/downloads/latesta64xebeta
After upgrading to this new version, make sure to restart Windows to finalize the upgrade.
Let me know if it helps.
-
On 4/5/2026 at 4:21 PM, Psychorama said:
It works, BUT, the same as with HWInfo, there are USB disconnects when multiple sources try to get information from the WireView 2.
Also, when you have "fast startup" enabled on Windows 11, the connection is not possible anymore, until you reboot, or turn off fast startup.
I know HWInfo fixed this issue, but i'm not sure how. When every monitoring accessing this information is turned off, it will most likely work.
@fip00 can you try to turn off fast startup, turn off auto-start off the wireview software, and possibly HWInfo? My biggest guess is it will start working again.
@Fiery can you look into this?
@fip00 @Sc00byD00 We've fixed the mentioned issues in the latest AIDA64 beta update available at:
https://www.aida64.com/downloads/latesta64xebeta
Let us know if it helps.
-
1
-
-
On 6/9/2026 at 10:21 PM, FitImagination said:
I just get "error: USB device not found." Im using the smaller thermalright version 6.x inch. Will this be added also?
AIDA64 only supports the 9.16" version at this time. We'll work on implementing support for other Thermalright devices.
-
7 minutes ago, Pondemon said:
Hi,
I've really enjoyed using the AIDA64 trial and would love to purchase a license. I was just wondering if there are any discounts or promotions currently available.
Many thanks!
Best regards
You've got a private message 😉
-
On 5/25/2026 at 6:28 PM, faintaxis said:
Hi,
I've got a CrystalFontz CFA-631 connected to my machine via USB. The PC detects it, and CFTest can send data to the LCD, but AIDA64 just says "LCD Init Failed". Have tried rebooting, reinstalling drivers, re-plugging etc, but no dice. I have a Matrix Orbital LCD and that seems to work fine, but the CrystalFontz refuses to work. USB dump below:
------[ Versions ]------
Program Version : AIDA64 Extreme v7.65.7400
LLKD Version : Driver couldn't start
BenchDLL Version: 4.7.916.8-x64
Windows Version : Microsoft Windows Server 2022 Standard 10.0.20348.3453 (64-bit)
GetProductInfo :------[ Motherboard Info ]------
Motherboard ID : <DMI>
Motherboard Model : Asus ROG Strix B450-F Gaming
Motherboard Chipset : AMD B450, AMD Taishan, AMD K17 IMCDMI MB Manufacturer : ASUSTeK COMPUTER INC.
DMI MB Product : ROG STRIX B450-F GAMING
DMI MB Version : Rev 1.xx
DMI MB Serial :
DMI SYS Manufacturer: System manufacturer
DMI SYS Product : System Product Name
DMI SYS Version : System Version
DMI SYS Serial : System Serial Number
DMI BIOS Version : 3103------[ USB Devices ]------
AMD USB 3.10 eXtensible Host Controller - 1.10 (Microsoft)
- [Port 1] < No Device Connected >
- [Port 2] < No Device Connected >
- [Port 3] < No Device Connected >
- [Port 4] < No Device Connected >
- [Port 5] < No Device Connected >
- [Port 6] < No Device Connected >
- [Port 7] Matrix Orbital MX2/MX3/MX6 USB Driver (MO USB LCD MX2xx)
- - Matrix Orbital MX2/MX3/MX6 USB Driver (COM4)
- [Port 8] < No Device Connected >
- [Port 9] < No Device Connected >
- [Port 10] < No Device Connected >
- [Port 11] Crystalfontz CFA631-USB (Crystalfontz CFA631-USB LCD)
- - Crystalfontz CFA631-USB (COM3)
- [Port 12] < No Device Connected >
- [Port 13] < No Device Connected >
- [Port 14] USB Composite Device (USB Emulation Device)
- - USB Input Device
- - - HID Keyboard Device
- - USB Input Device
- - - HID-compliant mouse
- - USB Input Device
- - - HID-compliant mouse
- - USB Mass Storage Device
- - - JetKVM Virtual Media USB Device
AMD USB 3.0 eXtensible Host Controller - 1.0 (Microsoft)
- [Port 1] < No Device Connected >
- [Port 2] < No Device Connected >
- [Port 3] < No Device Connected >
- [Port 4] < No Device Connected >
- [Port 5] < No Device Connected >
- [Port 6] < No Device Connected >
- [Port 7] < No Device Connected >
- [Port 8] < No Device Connected >------[ Matrix Orbital MX2/MX3/MX6 USB Driver]------
Device Description : Matrix Orbital MX2/MX3/MX6 USB Driver
Device ID : 0403-FA01
Device Class : FF / FF
Device Protocol : FF
Revision : 0400h
Manufacturer : Matrix Orbital
Product : MO USB LCD MX2xx
Serial Number : 00000785
Supported USB Version: 1.10
Current Speed : Full (USB 1.1)------[ Crystalfontz CFA631-USB]------
Device Description : Crystalfontz CFA631-USB
Device ID : 0403-FC0C
Device Class : FF / FF
Device Protocol : FF
Revision : 0600h
Manufacturer : Crystalfontz
Product : Crystalfontz CFA631-USB LCD
Serial Number : CF043902
Supported USB Version: 2.00
Current Speed : Full (USB 1.1)------[ USB Composite Device]------
Device Description : USB Composite Device
Device ID : 1D6B-0104
Device Class : 03 / 01 (Human Interface Device)
Device Protocol : 01
Revision : 0100h
Manufacturer : JetKVM
Product : USB Emulation Device
Supported USB Version: 2.00
Current Speed : High (USB 2.0)------[ DevClass / USB Hubs ]------
<DESC>USB Root Hub (USB 3.0)</DESC><DEVPATH>\\?\usb#root_hub30#5&e8a0ca7&0&0#{f18a0e88-c30c-11d0-8815-00a0c906bed8}</DEVPATH><INSTANCE>USB\ROOT_HUB30\5&E8A0CA7&0&0</INSTANCE><PARENTINST>PCI\VEN_1022&DEV_43D5&SUBSYS_11421B21&REV_01\4&115A0D29&0&000B</PARENTINST><BUSNUM>00000000</BUSNUM><ADDR>00000000</ADDR>
<DESC>USB Root Hub (USB 3.0)</DESC><DEVPATH>\\?\usb#root_hub30#5&38465d31&0&0#{f18a0e88-c30c-11d0-8815-00a0c906bed8}</DEVPATH><INSTANCE>USB\ROOT_HUB30\5&38465D31&0&0</INSTANCE><PARENTINST>PCI\VEN_1022&DEV_145C&SUBSYS_87471043&REV_00\4&2392ABC8&0&0339</PARENTINST><BUSNUM>00000000</BUSNUM><ADDR>00000000</ADDR>------[ DevClass / USB Devices ]------
<DESC>Matrix Orbital MX2/MX3/MX6 USB Driver</DESC><DEVPATH>\\?\usb#vid_0403&pid_fa01#00000785#{a5dcbf10-6530-11d2-901f-00c04fb951ed}</DEVPATH><INSTANCE>USB\VID_0403&PID_FA01\00000785</INSTANCE><PARENTINST>USB\ROOT_HUB30\5&E8A0CA7&0&0</PARENTINST><BUSNUM>00000000</BUSNUM><ADDR>00000007</ADDR><REV>0400</REV>
<DESC>USB Composite Device</DESC><DEVPATH>\\?\usb#vid_1d6b&pid_0104#6&e9bcfe3&0&14#{a5dcbf10-6530-11d2-901f-00c04fb951ed}</DEVPATH><INSTANCE>USB\VID_1D6B&PID_0104\6&E9BCFE3&0&14</INSTANCE><PARENTINST>USB\ROOT_HUB30\5&E8A0CA7&0&0</PARENTINST><BUSNUM>00000000</BUSNUM><ADDR>0000000E</ADDR><REV>0100</REV>
<DESC>Crystalfontz CFA631-USB</DESC><DEVPATH>\\?\usb#vid_0403&pid_fc0c#cf043902#{a5dcbf10-6530-11d2-901f-00c04fb951ed}</DEVPATH><INSTANCE>USB\VID_0403&PID_FC0C\CF043902</INSTANCE><PARENTINST>USB\ROOT_HUB30\5&E8A0CA7&0&0</PARENTINST><BUSNUM>00000000</BUSNUM><ADDR>0000000B</ADDR><REV>0600</REV>------[ DevClass / Human Interface Devices ]------
<DESC>HID-compliant mouse</DESC><DEVPATH>\\?\hid#vid_1d6b&pid_0104&mi_01#8&205ccbde&0&0000#{4d1e55b2-f16f-11cf-88cb-001111000030}</DEVPATH><INSTANCE>HID\VID_1D6B&PID_0104&MI_01\8&205CCBDE&0&0000</INSTANCE><PARENTINST>USB\VID_1D6B&PID_0104&MI_01\7&21FB731F&0&0001</PARENTINST><BUSNUM>00000001</BUSNUM><ADDR>00000001</ADDR><REV>0100</REV>
<DESC>HID Keyboard Device</DESC><DEVPATH>\\?\hid#vid_1d6b&pid_0104&mi_00#8&8993f99&0&0000#{4d1e55b2-f16f-11cf-88cb-001111000030}\kbd</DEVPATH><INSTANCE>HID\VID_1D6B&PID_0104&MI_00\8&8993F99&0&0000</INSTANCE><PARENTINST>USB\VID_1D6B&PID_0104&MI_00\7&21FB731F&0&0000</PARENTINST><BUSNUM>00000000</BUSNUM><ADDR>00000001</ADDR><REV>0100</REV>
<DESC>HID-compliant mouse</DESC><DEVPATH>\\?\hid#vid_1d6b&pid_0104&mi_02#8&37a71e4&0&0000#{4d1e55b2-f16f-11cf-88cb-001111000030}</DEVPATH><INSTANCE>HID\VID_1D6B&PID_0104&MI_02\8&37A71E4&0&0000</INSTANCE><PARENTINST>USB\VID_1D6B&PID_0104&MI_02\7&21FB731F&0&0002</PARENTINST><BUSNUM>00000002</BUSNUM><ADDR>00000001</ADDR><REV>0100</REV>------[ DevClass / COM Ports ]------
<DESC>Crystalfontz CFA631-USB (COM3)</DESC><DEVPATH>\\?\ftdibus#vid_0403+pid_fc0c+cf043902a#0000#{86e0d1e0-8089-11d0-9ce4-08003e301f73}</DEVPATH><INSTANCE>FTDIBUS\VID_0403+PID_FC0C+CF043902A\0000</INSTANCE><PARENTINST>USB\VID_0403&PID_FC0C\CF043902</PARENTINST><BUSNUM>00000000</BUSNUM><ADDR>0000000B</ADDR>
<DESC>Communications Port (COM1)</DESC><DEVPATH>\\?\acpi#pnp0501#0#{86e0d1e0-8089-11d0-9ce4-08003e301f73}</DEVPATH><INSTANCE>ACPI\PNP0501\0</INSTANCE><PARENTINST>PCI\VEN_1022&DEV_790E&SUBSYS_87471043&REV_51\3&11583659&0&A3</PARENTINST><BUSNUM>00000000</BUSNUM>
<DESC>Matrix Orbital MX2/MX3/MX6 USB Driver (COM4)</DESC><DEVPATH>\\?\ftdibus#vid_0403+pid_fa01+00000785a#0000#{86e0d1e0-8089-11d0-9ce4-08003e301f73}</DEVPATH><INSTANCE>FTDIBUS\VID_0403+PID_FA01+00000785A\0000</INSTANCE><PARENTINST>USB\VID_0403&PID_FA01\00000785</PARENTINST><BUSNUM>00000000</BUSNUM><ADDR>00000007</ADDR>------[ DevClass / LPT Ports ]------
< No LPT Port Found >
------[ DevClass / Modems ]------
< No Modem Found >
------[ DevClass / SideShow Devices ]------
< No SideShow Device Found >
------[ DevClass / GX3 Devices ]------
< No GX3 Device Found >
------[ DevClass / USBXpress Devices ]------
< No USBXpress Device Found >
------[ DevClass / WinUSB Devices ]------
< No WinUSB Device Found >
------[ LibUsb0 Devices ]------
< No LibUsb0 Device Found >
------[ CH341 Devices ]------
< No CH341 Device Found >
------[ FTD2xx Devices ]------
< No FTD2xx Device Found >
------[ LibMPSSE Devices ]------
< No LibMPSSE Device Found >
------[ SiUSBXp Devices ]------
SiUSBXp.dll Path =
< No SiUSBXp Device Found >
------[ T-Balancer Devices ]------
< No T-Balancer Device Found >
------[ Koolance TMS-200 Devices ]------
< No T-Koolance TMS-200 Device Found >
------[ GRID+ V3 Devices ]------
< No GRID+ V3 Device Found >
------[ Smart Dev V2 Devices ]------
< No Smart Dev V2 Device Found >
------[ Kraken X-2/X-3 Devices ]------
< No Kraken X-2/X-3 Device Found >
------[ Lian Li Uni Devices ]------
< No Lian Li Uni Device Found >
------[ Razer PWM Devices ]------
< No Razer PWM Device Found >
Any ideas!?
We've fixed the handling of CFA631 in the latest beta version of AIDA64 Extreme available at:
https://www.aida64.com/downloads/latesta64xebeta
After upgrading to this new version, make sure to restart Windows to finalize the upgrade.
Let me know if it helps.
-
On 6/6/2026 at 10:31 PM, an7user said:
Hi,
Any chance I could get a promo code for AIDA64 Extreme?
I’ve been using an older version mainly for my Beada LCD sensor panel, but I recently upgraded to a Trofeo Vision 9.16 LCD. From what I can tell, proper support for it is only in the latest June 3 beta, so I’d like to get current with an official license instead of messing around with random third-party keys.
Would really appreciate it if there’s any discount code available.
I've sent you a private message about this.
-
10 hours ago, andsoitgoes said:
Hi - Trying to figure out if it's possible to change this, but on the x570 motherboard, the fans show incorrectly in the sensor icons
Is there anything that could be done to change this?
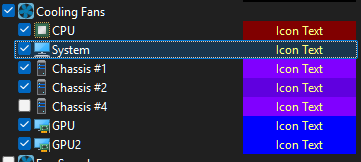
I'm not sure what the problem is exactly. Please explain the issue with more details.

Ryzen 8700G Incorrect iGPU memory read speed in GPGPU test.
in Bug reports
Posted
Our benchmark reflects the performance of GPUs using OpenCL. When there's a bottleneck due to OpenCL limitations then AIDA64 will reflect that too.