Garfunkel
-
Posts
116 -
Joined
-
Last visited
Content Type
Profiles
Forums
Events
Everything posted by Garfunkel
-
AIDA misses 1 temperature value on my board HW monitor named it TMPIN1 so as in Open hardware monitor; HWiNFO64 named it Auxiliary. Just a request for Aida to show it too. This temperature is like the Northbridge part of the motherboard (MCH) isasensordump.txt
-
FX 8320e Original clock is detected wrong, Aida shows 3500Mhz but the original clock is 3200Mhz 3500 is CPU's Boosted P State #2
-

ATI Radeon HD 4250 iGPU 0% utilization reading (MS-7641)
Garfunkel replied to Garfunkel's topic in Bug reports
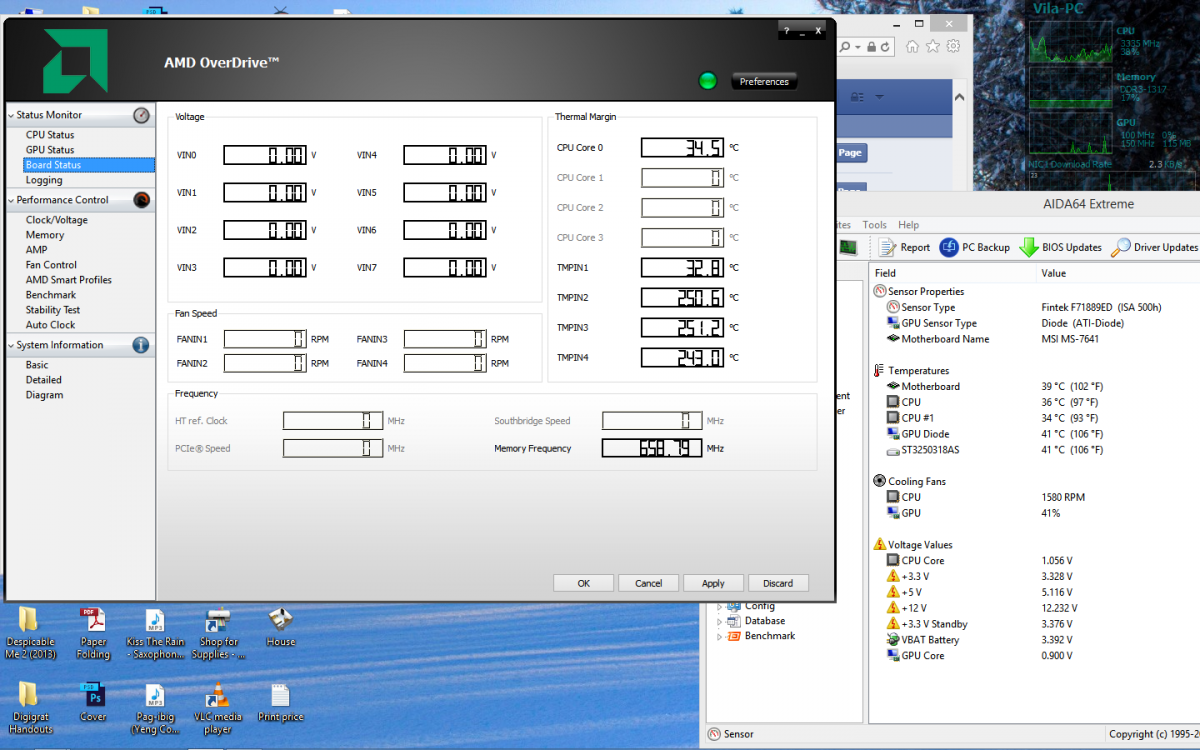
Sure and here is the screenshot I also added readings from AMD
-
ATI Radeon HD 4250 iGPU 0% utilization reading (MS-7641)
Garfunkel replied to Garfunkel's topic in Bug reports
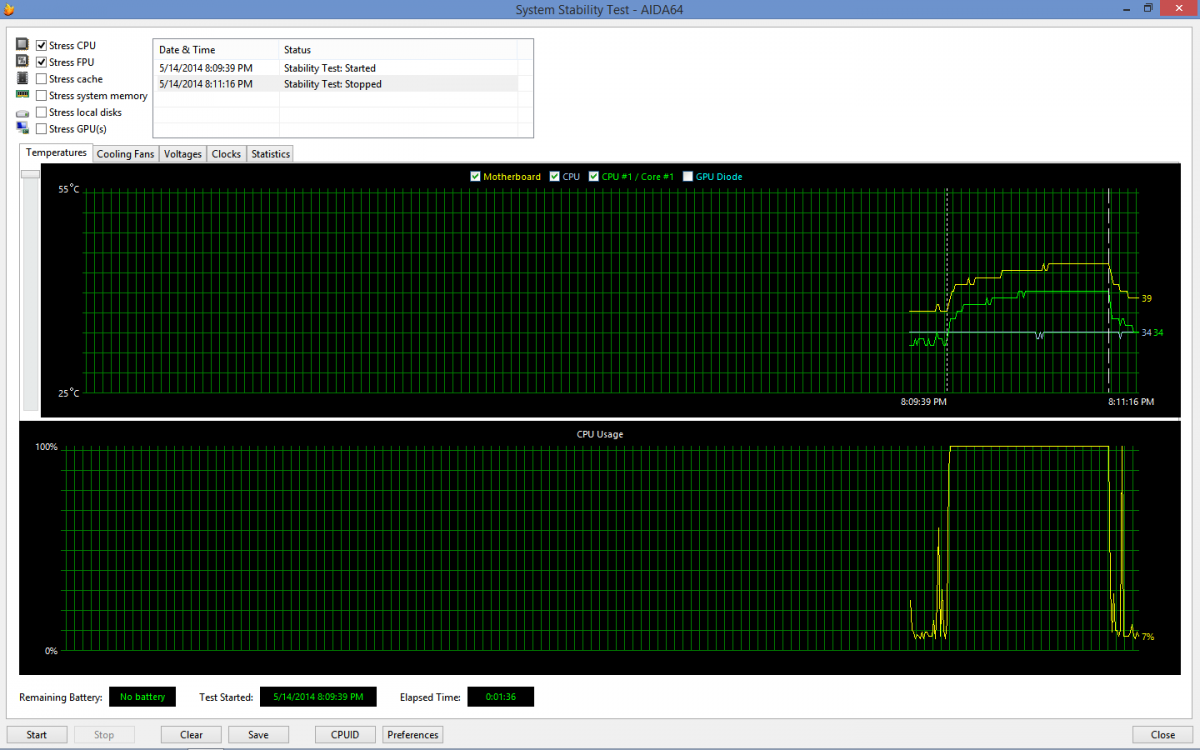
Sir I have new Issue CPU, CPU core, Motherboard temperature have swapped values Mother board temp is I think for CPU core CPU temp is I think for motherboard CPU core temp is I think for CPU - I don't know if this is only for my CPU and board combination .. also I think even they are corrected those values slightly wrong I have figured it out using the Stress tests and thank you in advanced -
ATI Radeon HD 4250 iGPU 0% utilization reading (MS-7641)
Garfunkel replied to Garfunkel's topic in Bug reports
Thank you very much I will test it now -
Hello, I am experiencing zero reading in integrated GPU utilization I'm not using the driver from Windows update, I only use the driver from MSI Live Update AMD system monitor and MSI afterburner gets the right utilization values Also +5V and +12V readings are wrong Report.htm
-
Sir do you have plans for sensor panel graph that handles the graph not to exceed the limit, other that the auto scaling Just like EVGA precision does in their graph, that doesn't draw the exceeding lines instead drawing it in full with mark sorry for my English
-
Hi, Just want to request a Pinger item/object in sensr panel. An object to ping a Host, IP or URL and show it as a graph, bar or other item... Just to easily manage long ranged wireless connection and to easily see the their strength and also of the Internet connection
-
Sensor panel Feature request Update frequency per item So I can make a sensor panel similarly to the system stability test for example I want the temperatures to update every 5 seconds CPU utilization in every 1 seconds Memory utilization in every 3 seconds Voltages in every 10 seconds Adding shapes just the basic shapes such as line, oval and especially rectangle to help grouping the items
-
Why my benchmark in older version of aida64 different from the latest
-
Thanks for support commands are working well just like you said… em sorry and like you said it takes hours before AIDA64 launches the command again with same condition so I cant use this trick with AIDA64 em just looking for an alternative tool for NVIDIA System Tools as it is very outdated and unstable i cant also use MSI afterburner as it limits the overcooking ability to 30% again thanks AIDA64 team
-
My command line is based on the "Create Clock Shortcut" feature of NVidia Inspector (but removed those shader clock commands) I'm currently using that command line in Windows task scheduler at logon and it works By the way what is the difference between "Number of ours between sending repetitive alerts" and "Update Frequency/Alerting" I set alerting into 1 and Hours into 2, and does it matter ? - - - EDIT - - - Got the commands working. I just restarted the PC and the alerting triggered (tested with an alert window just to ensure that alerting is triggered and command is working and it does) at first I thought that the double quote is the problem my settings on < 50% utilization drop clock on lowest, not 0 on > 90% utilization just return to its default clock I think alerting cant meet up what I want to, because once alerting is triggered it wont trigger again. on logon the first one triggered. and when I stressed it out the second one triggered but when I stopped stressing the first one didn't trigger... is there something wrong on my settings?? why it didn't call again
-
I don't have that directory i'm using 32 Bit system
-
This is one of the commands "C:\Program Files\NVIDIA Inspector\nvidiaInspector.exe" -setGpuClock:0,0,620 I also run it with two triggers, GPU and motherboard temp I have a total of 8 alert items, 4 for GPU and 4 for Motherboard with different temperature triggers and if possible I'll also add GPU Utilization
-
Hi, I'm trying to use AIDA64 with NVIDIA inspector I tried to use AIDA alerting to launch NVidia inspector in some certain temperatures just to make temperature dependent overclocking but it seems AIDA cant run NVidia inspector with command lines I tried putting quotations but it doesn't work is there a possibility to achieve this trick ??
-
ohhh I gorret... Thanks for support... also I noticed that this value automatically disappears on some mobile PC
-
I got a new idea Why not make a new field that has inverted sign for Battery charge rate value and name it "Battery Discharge rate" Battery charge rate is displayed when Battery Charge rate is positive and battery discharge rate is displayed when Battery charge rate is negative or just hide it and show the battery discharge rate based on "Power management" page in sensor page they have near value sorry for my English
-
"Battery Charge Rate" is displayed in negative value. I think it must be "Battery Discharge Rate" (or something much better) when it is on Negative Value (with sign changed to positive) and remains "Battery Charge Rate" when in positive value... Wish I explained it clearly
-
ahh I see Thank you for the fix
-
Ahhh… I understand
-
BUG>> Double click on labels and Read columns are working Burt Write, Copy and latency columns works on single click You also forgot to disable clicking on objects that are not active such as L3 when L3 cache is not available For me, I prefer single click but I think there are reasons why it is double… Also why not try to display the info's on load such as CPU type, clock, fsb and below items... but don't remove the refreshing thing when starting the test
-
Thanks you… Thank YOU!!!!!
-
so sad that you cant implement that thing, But what do you mean on semi-automatic?? that thing attracted me Anyway just to let you know, It seems the latest beta of AIDA loads longer than I first tried AIDA before but it is not that very noticeable
-
It makes more convenient for me because I can select what to benchmark (clicking one by one) without measuring all of them and save if I'm satisfied with the score Now I got It why there are extra buttons specially RDMSR that I don't know. But I like the enable/disable turbo thing
-
Uhmm I mean how can I make it not reach the 1 value. For example: i'll set a value for its maximum... if the network speed is is greater what ive set then Auto-scaling will automatically scale the graph's and maximum scale values... if less than then set maximum scale value to what I've set..... something like that