MrCommunistGen
-
Posts
15 -
Joined
-
Last visited
Content Type
Profiles
Forums
Events
Everything posted by MrCommunistGen
-
GPU Utilisation missing from sensors
MrCommunistGen replied to SnarlingFox's topic in Hardware monitoring
I understand that you're intentionally running an older GPU driver version, but are you comfortable trying the latest version temporarily to see if the metric comes back in the latest versions of AIDA64? You can always run DDU and then re-install your older version after checking the behavior. That might help narrow it down for them to see if it's a regression they've introduced where maybe they're only querying GPU utilization with a new mechanism that's only available in the newer driver but should be falling back to an old mechanism when an older driver is being used. -
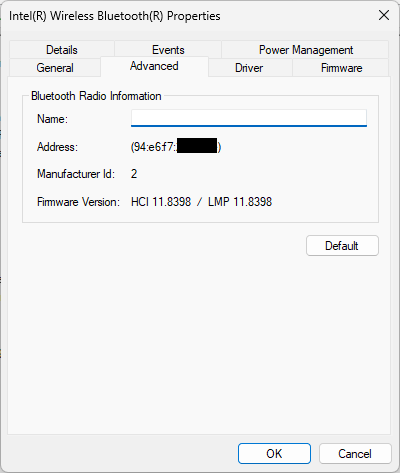
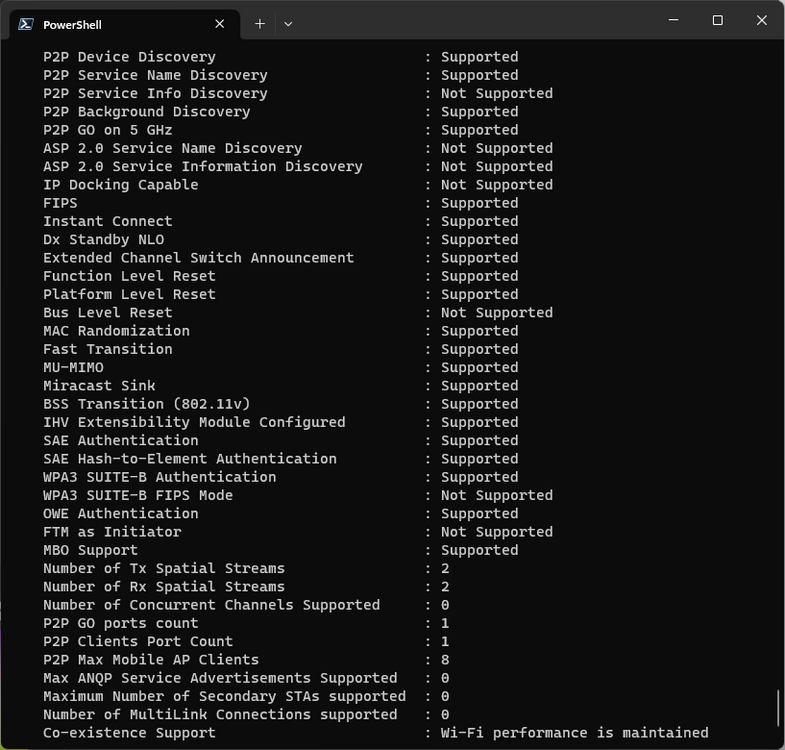
I'm sure I'm late to the party, but I just discovered that if you run: netsh wlan show wirelesscapabilities It will show you a plethora of attributes of the Wi-Fi adapter/driver in your system, including whether it supports MU-MIMO, WPA3, etc. I could see this being really valuable information for people to have easily accessible in AIDA64, and I can't seem to find that anywhere in AIDA64. There's additional information that can be gleaned from netsh wlan show all But then you have to parse through the details about all saved and in-range networks... I didn't go digging to see if there's a set of arguments you can pass that'll show all the network adapter capabilities without showing all the networks... I also recently found out that you can determine the Bluetooth version supported by the BT adapter by checking it's LMP version, where 11 is BT 5.2, 12 is BT 5.3, etc. I think this information would be very useful as Windows goes out of its way to not tell you the Bluetooth version your device has. Of course, I'm assuming that this info can theoretically be scraped by AIDA64, though given the completeness of the other information provided by the app, I believe that it's possible. I suspect you have a software development lifecycle for new features that isn't super fast, so it's not like I'm hoping for these to be added in the next major release, but it's something I'd love to hear has ended up on your roadmap. Thanks for your consideration!
-
Thanks!! I'll try that out when I get a chance.
-
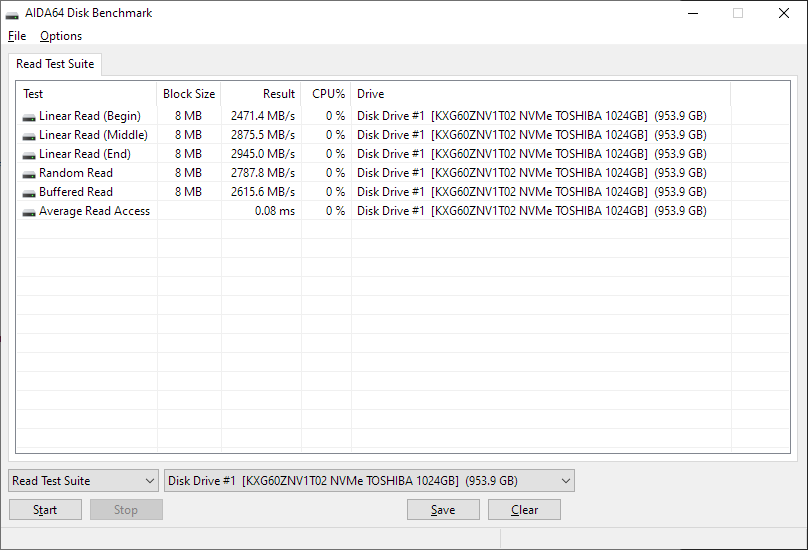
I'm trying to use the "Linear Write" Disk Benchmark to quantify and visualize the write speed on several different SSDs I'm considering for use for backing up large files -- so linear write performance is exactly what I'm looking for. I really like the graphs the tool generates because it helps visualize how the drive performs as it fills. For the drive in my screenshot below, the average is shown as 1598.3MB/s -- which seems right considering the shape of the graph and my experience with the drive. However, I was trying to validate the Average speed reported by the tool and came up with some inconsistencies. I'm operating under three main assumptions: The benchmark writes the full capacity of the drive, no more, no less. There isn't any idle time between block writes or elsewhere in the test. The timer is accurately reporting the length of the benchmark If you take the number of MB written -- the size of the drive -- in this case 976,793.6MB (953.9GB * 1024) and divide that by the time elapsed 1031sec ((17min * 60) + 11) you get 947MB/s. I performed another iteration of this test and used a camera to record the whole benchmark so I could validate how long it took (I didn't trust myself with a stopwatch), and the time reported by the benchmark ~17min was pretty close to the amount of time measured in my recording... so the issue isn't related to the timer in the benchmark reporting the wrong time. In Windows I've seen this drive definitely be able to sustain writes over 1.3GB/s (anecdotally), so my calculated 947MB/s definitely doesn't seem right, but then that means that one of my first two assumptions is wrong -- either the timer in the benchmark is including idle time, extending how long it takes to perform the disk write, or the test is performing more writes than the full capacity of the drive. The latter of these two seems unlikely, but that's just a gut feeling. -- Can you provide any insight into how the tool calculates the average speed or any thoughts as to why this discrepancy exists? Is there a way to export the datapoints used for the calculations? Thanks!!

-
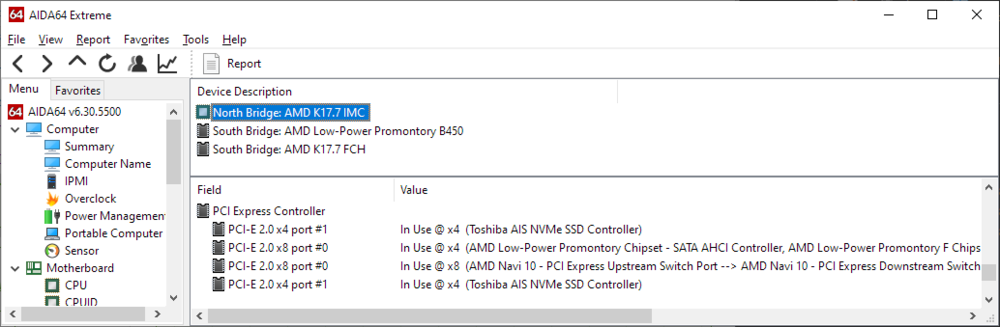
I'm pretty sure this has been a long standing issue, not one introduced by a recent update. I don't know whether the on-package I/O die's PCIe capabilities are hardcoded or have to be detected for 400-series chipset boards (PCIe 3.0) vs 500-series chipset boards (PCIe 4.0), but at least on my ASUS ROG STRIX B450-I motherboard, the lanes are reported back as being PCIe 2.0 despite the fact that they're configured to 3.0 in BIOS and that I've observed that they're not actually running at 2.0 speeds. SSD bandwidth reads at greater than the 2GB/s they'd be capped to if the drives were actually running at 2.0 speeds, and GPU PCIe bandwidth comes in at higher than the 4GB/s that it would be capped to were it running at 2.0 speeds. As is often the case when I point out irregularities on an ASUS board, if the issue is down to their WMI interface, just let me know and I'll just ignore the incorrect values.
-
Thanks for the update! I'll see if I can find a way to report the bug to ASUS.
-
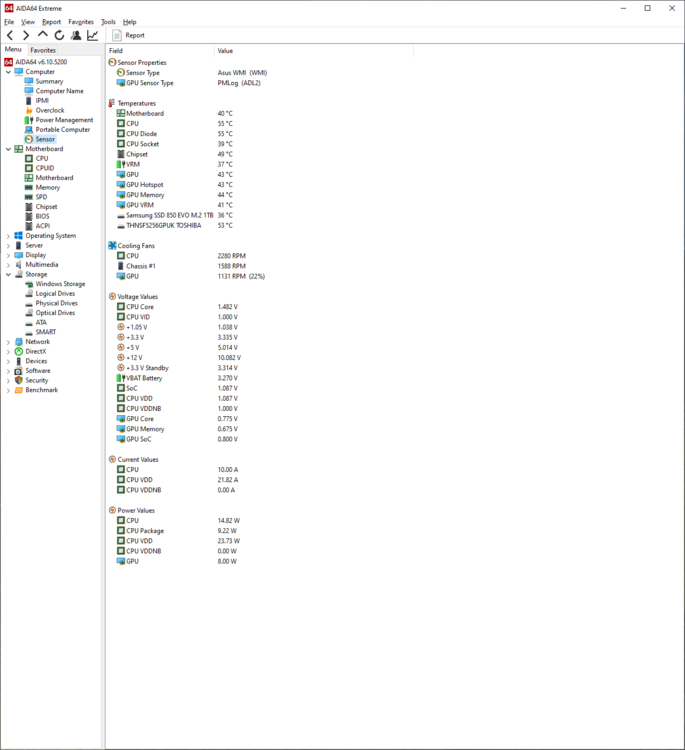
I just upgraded my Asus ROG Strix B450-I Gaming to its latest BIOS (2801) which contains the 1.0.0.3 ABBA AGESA version. I don't remember if there was an issue with the voltage reading before the update, but there's clearly an issue now. I also updated AIDA64 to v6.10.5200 recently. At idle, the +12V shows ~10.082V, and when the system is loaded it shows ~9.973V. These values are clearly wrong as the system would not be stable with that low of an input voltage. For what it is worth, my PSU is a Corsair SF600 Platinum. Using a different tool I'm seeing 12.034V at idle and 11.968V under load. I've attached a report of the system at idle. B450-I Report 09282019.htm
-
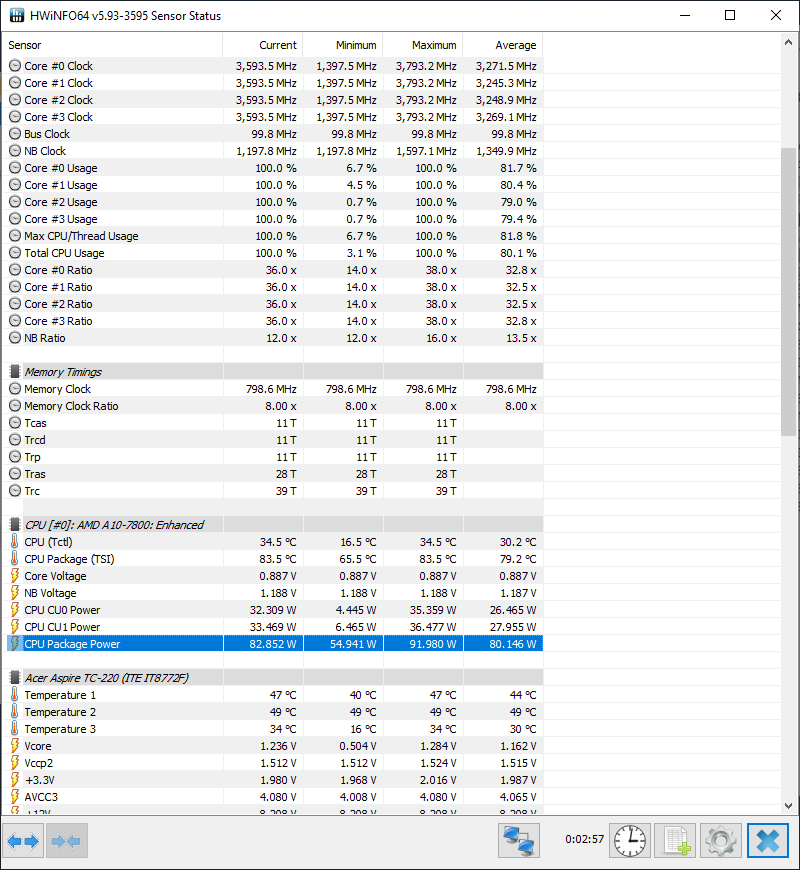
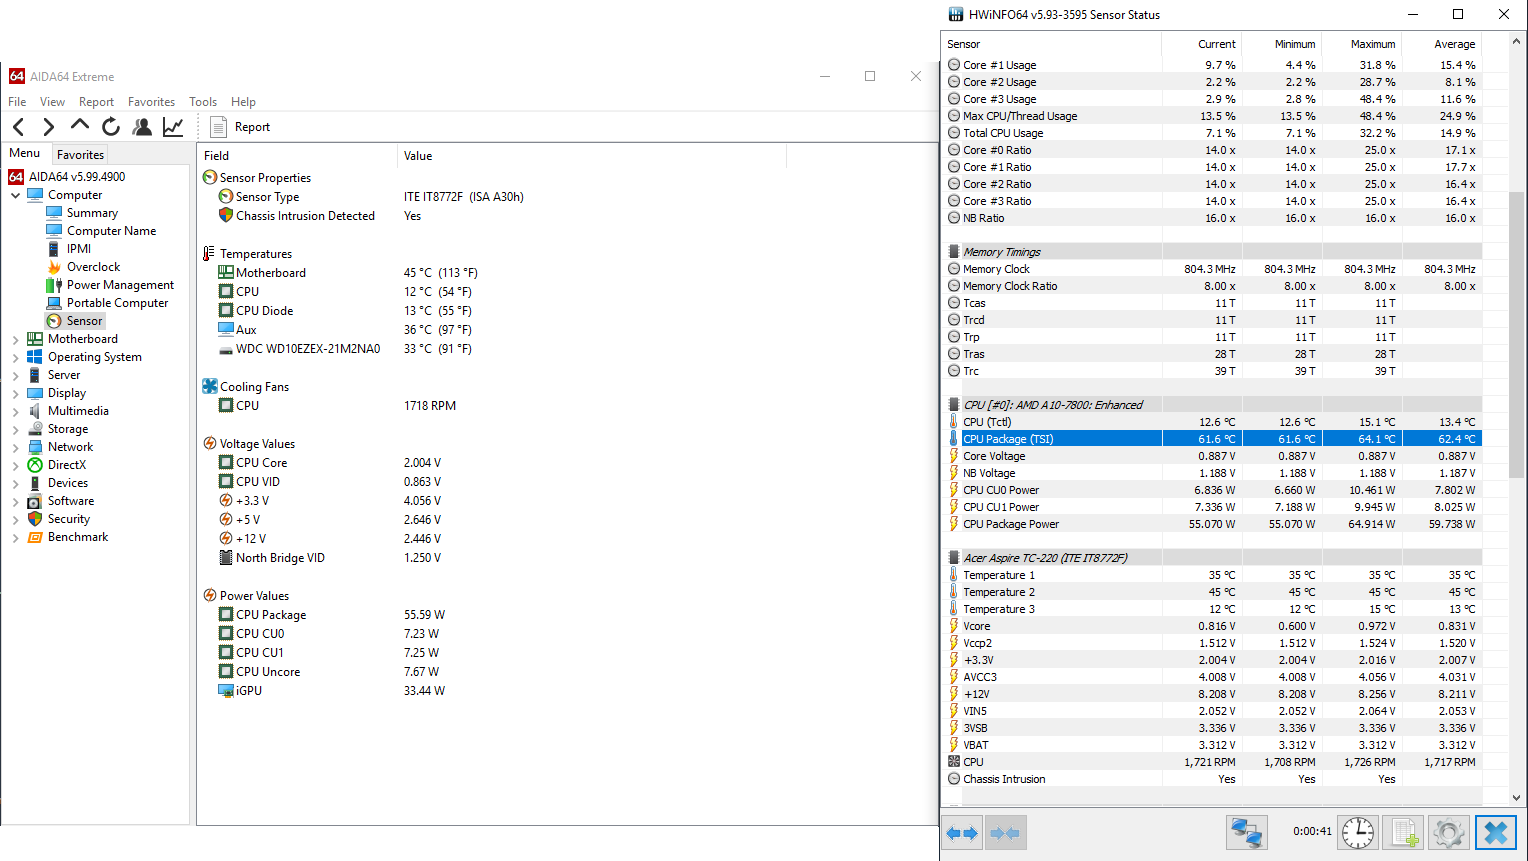
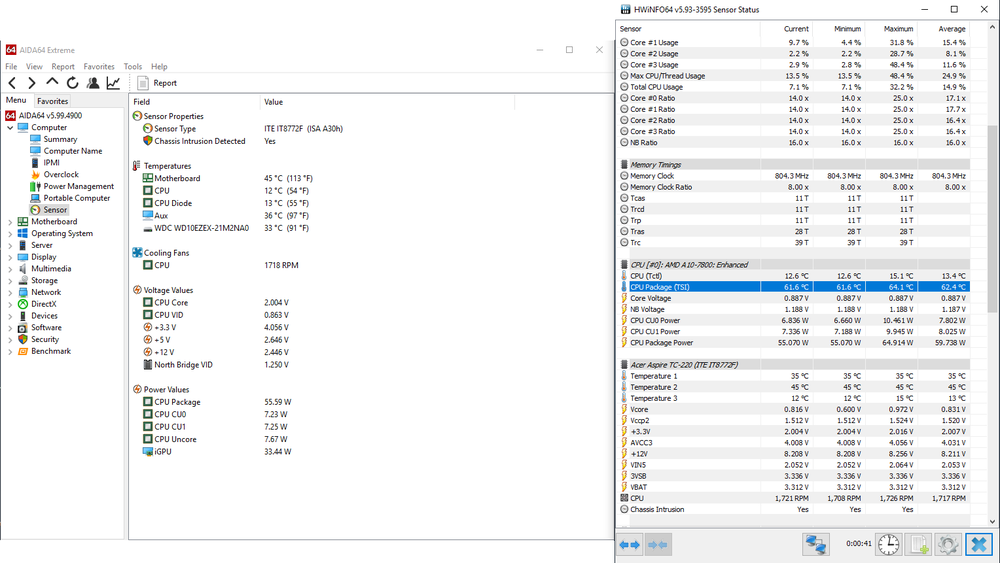
Sorry I was away on vacation for the winter holiday. I'm back now and I did a bit of testing. At idle "Aux" was reading 40C. I then used the AIDA64 CPU stress test (CPU only) and the temp of Aux slowly increased to 49C after several minutes, but the other CPU temp readings increased sharply. Then I stopped the CPU stress test and the Aux reading slowly decreased back to 43C after several minutes. The other CPU measurements dropped sharply (as I would expect). This leads me to believe that AUX is NOT the CPU temperature, but some other component on the motherboard. I have 0 evidence to support it, but my guess would be that it is a VRM temperature. I certainly don't have enough confidence to say that Aux should be relabeled to anything else (it should stay as Aux). For what it is worth, Aux corresponds with what HWinfo is calling "Temperature 1" on the ITE IT8772F. What's interesting is that the Tctl and TSI are always offset by 49C, though I don't believe that either value is the true CPU temperature either. Both temps seem to move up and down as the CPU is placed under load, but there is some missing offset needed to correct the temps to the true values... Tctl is too low and TSI is too high. TSI suggests that the CPU idles at 65.5C and hits a load temp of 83.5C. The stock cooler on this CPU is bad, but it isn't *that* bad. Also, while the heatsink is warm to the touch, it isn't anywhere near that hot. I would say that without having more information there is no way to get the correct CPU temperature from the sensor data available.

-
So I just started right-clicking everything and I found that if I right-click "Sensor Properties" it'll give me some sort of debug output. I'll attach that here. acer sensor debug.txt
-
I have an Acer TC-220 where the CPU temperatures are reported incorrectly. Reported temperatures of a CPU under load are sub-ambient and I'm just using the standard air cooler. It looks like either the motherboard is reporting the wrong temperatures, or they are using a non-standard offset, because another program is reporting a false reading for Tctl as well. However, the other program also reports "CPU Package (TSI) - and the value looks like a reasonable value - but this value isn't reported in AIDA64. I saw on another sensor related bug ticket the instruction was to: But I don't see how to do that, otherwise I'd go ahead and include that info in the initial report.
-
AIDA64 compatibility with AMD Ryzen processors
MrCommunistGen replied to Fiery's topic in General Discussion
I don't know if this is the right place to post this, and I don't know if this source counts as "official" enough for your criteria to be included in your database, but it looks like in this Anandtech article they state the manufacturing process as well as TDP for the AMD X470 chipset (and X370 if you don't already have that info in the database). Just trying to do my part to improve this super useful tool! Thanks!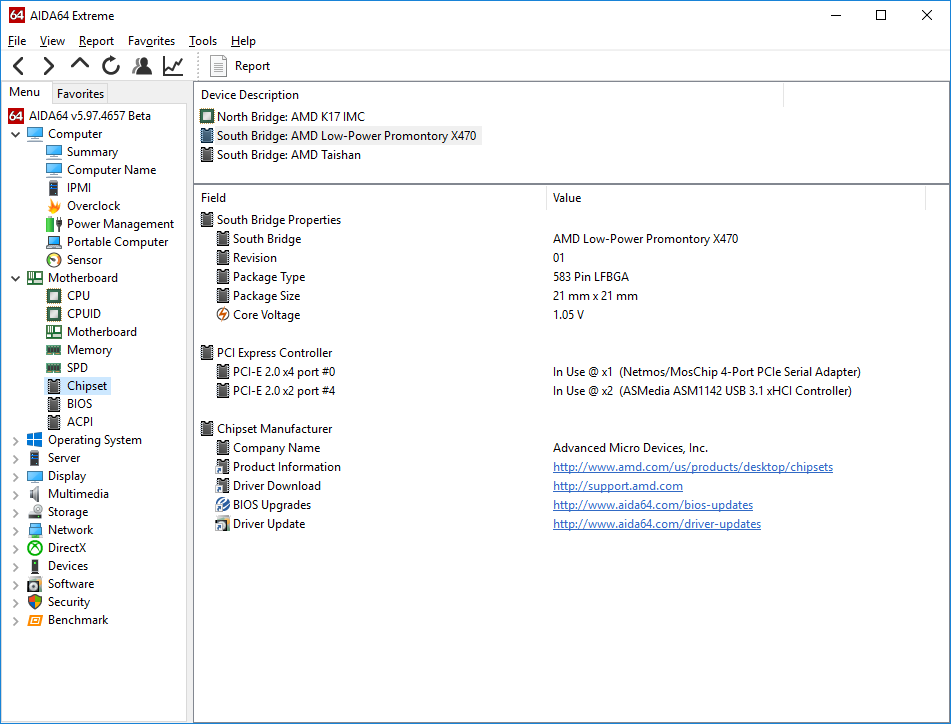
-
GPGPU Benchmark incorrect spec on HD4400
MrCommunistGen replied to MrCommunistGen's topic in Bug reports
Cool. Thanks for the info. I think Intel is done with driver releases for Haswell/Broadwell generation graphics so this will probably never get fixed. Feel free to close this topic (if that's something you do on this forum). -
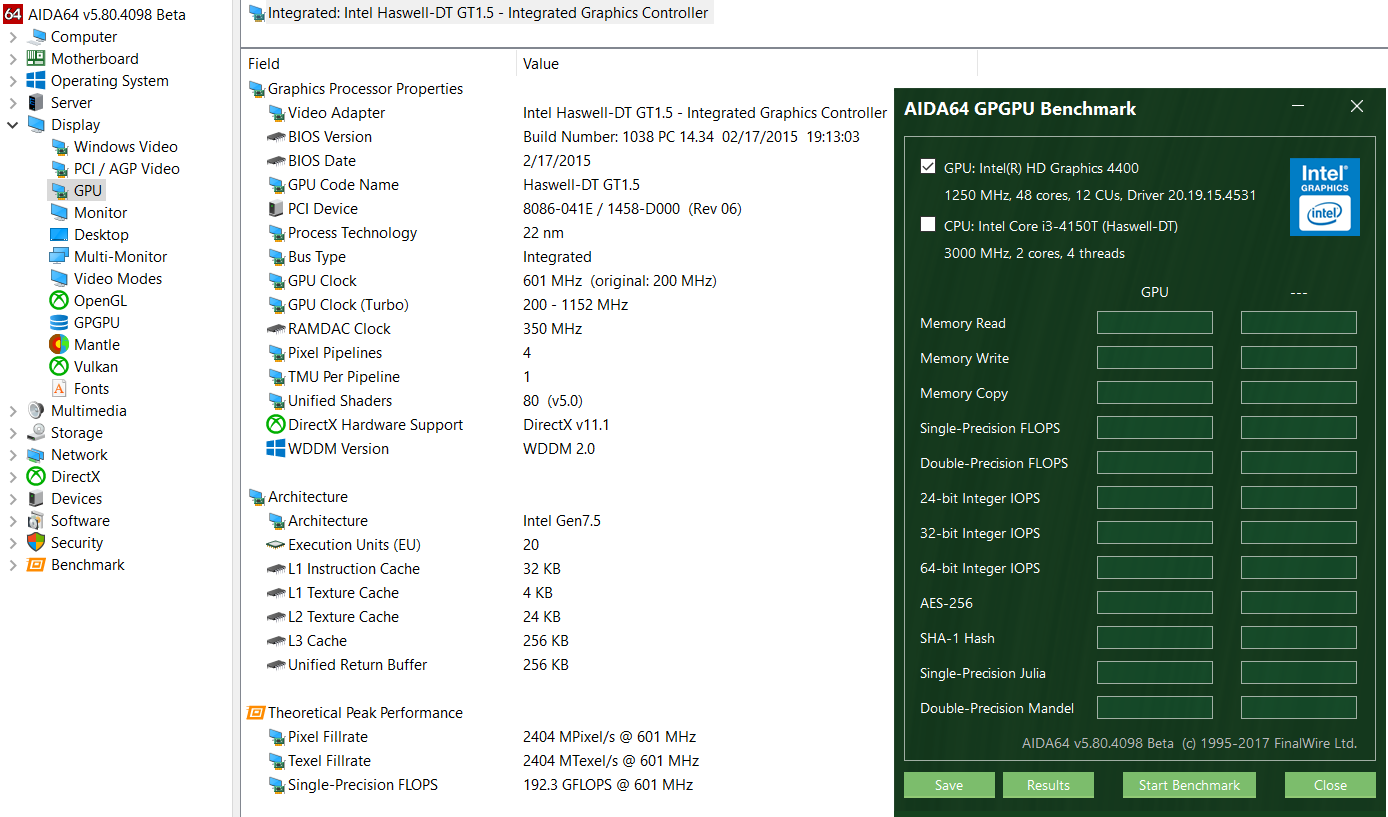
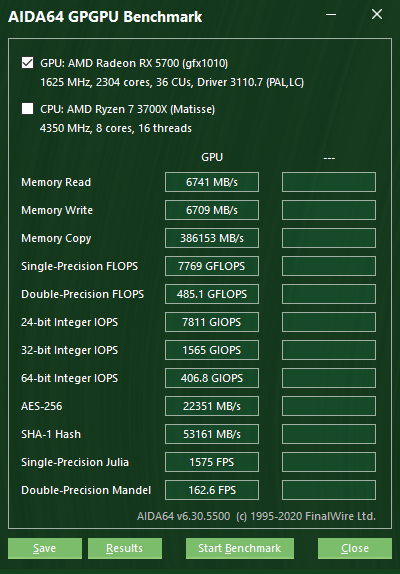
For some reason the GPGPU Benchmark screen shows different specs for the Intel HD4400 iGPU compared to what the GPU section in the main AIDA64 program shows. GPGPU Bench lists 12 CU/48 cores GPU page lists 20 EU/80 cores As far as I am aware, the 20EU/CU listed on the GPU page is the correct configuration for HD4400 (as well as HD4200 and HD4600). I also have a Haswell Pentium. That chip shows the same, (correct) value (10EU/CU) on both the GPU and GPGPU bench pages.

-
fixed: Missing Intel X99 chipset Process Technology
MrCommunistGen replied to MrCommunistGen's topic in Bug reports
I know it is a super late response, but THANKS!! I saw it right away in the next beta. -
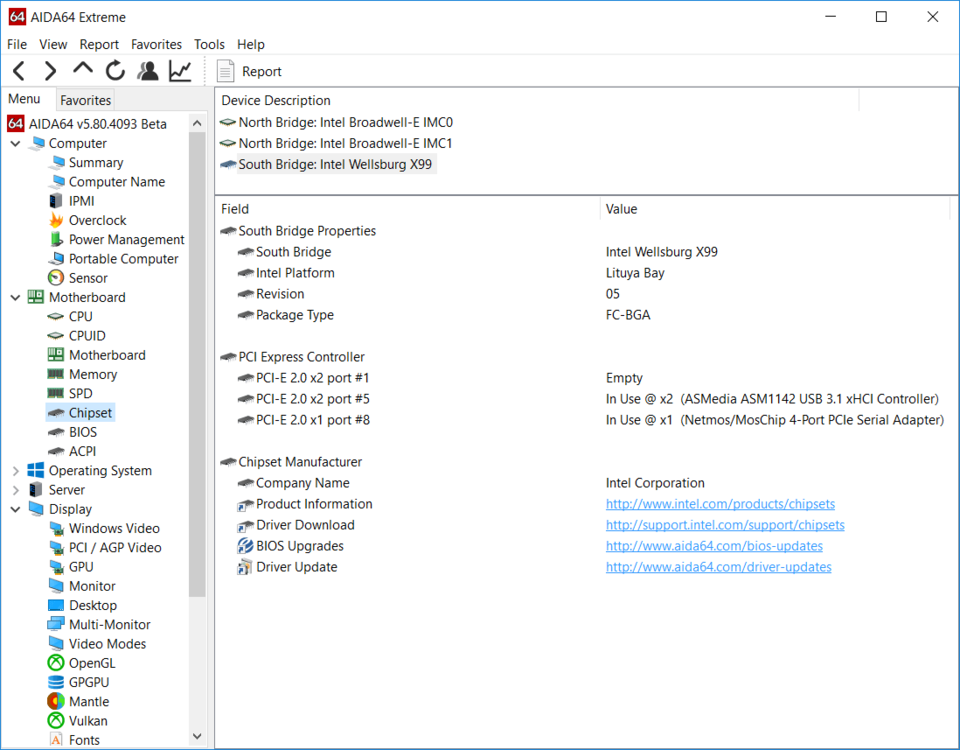
Super minor, but it looks like the "Process Technology" field under "Chipset" for Intel Wellsburg X99 is missing. As per: http://ark.intel.com/products/81761 X99 is 32nm