BHSY
-
Posts
297 -
Joined
-
Days Won
54
Content Type
Profiles
Forums
Events
Everything posted by BHSY
-
These panel templates are now offered in 2560x750 resolution. To maintain a clean and organized forum layout, images have been resized to thumbnails. Click any thumbnail to view the full panel. Requirement: AIDA64 version 7.70.7500 or Beta 7.99.7829 or newer is needed. Visit BHSYSensorPanel for more info. and designs.
-
The panel must be created in 100% display scale. If you're primary monitor is using 4K resolution, 3840x2160 with a 150% scale, the image will increase by 1.5x. The image file itself doesn’t change — its pixel dimensions remain the same. When displayed on a 150% scale setting, it will appear 50% larger visually. Fix the problem without changing the display scale using "Change high DPI settings Go to "C:\Program Files (x86)\FinalWire\AIDA64 Extreme\ and right-click the aida64.exe and select Properties" or look for the AIDA64.exe file if you use the portable ZIP package downloaded from AIDA64. Select the 'Compatibility tab'. Click on the 'Change high DPI settings' Select/check the "Override high DPI scaling behaviour. Scaling performed by:" and Select "System" from the drop-down list. Click OK. If the panel still looks the same, close and reopen the AIDA64 program, or try reimporting the sensor panel file again.
-
-
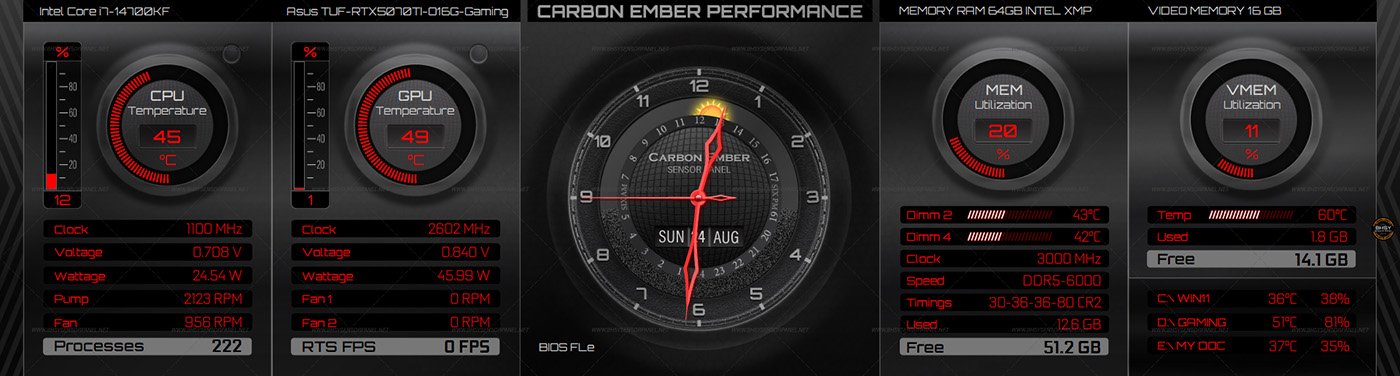
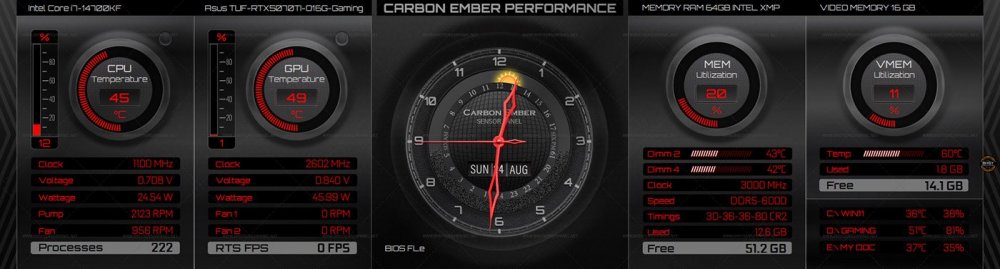
After a week of posting the RED HOT Sensor Panel with Analogue Clock panel, now it comes in black, CARBON EMBER. Ready-made size available in 1920x515 / 1920x480 / 515x1920 / 480x1920. Video Demo of the Sun and Moon rotating: https://youtube.com/shorts/xOZ0ScfgPo0?feature=share Note: Requires AIDA64 version 7.70.7500 or Beta 7.99.7829 or above. Visit BHSYSensorPanel for more info. and designs.
-
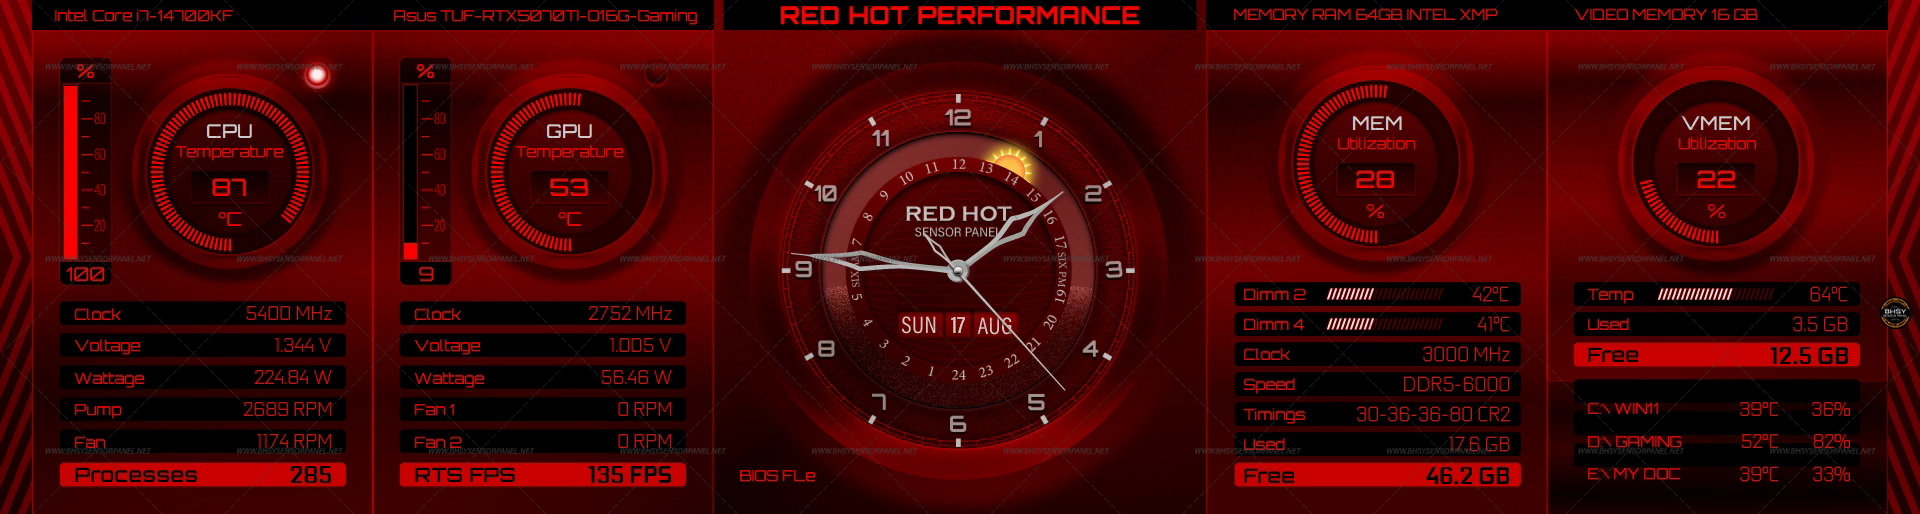
66-AIDA64 RED HOT Sensor Panel with Analogue Clock Available in 1920x515 / 1920x480 / 480x1920 / 515x1920 / 1600x1200. For other sizes, please PM me or send a contact form from the website. Why settle for a plain Windows 11 taskbar time? Monitor your system and check the time in one stunning interface—function meets finesse. The black and red stripe is a modular design feature that can be repositioned or removed entirely to suit your layout preferences. Whether you're aiming for a cleaner aesthetic, improved readability, or better alignment with your sensor panel theme, this stripe offers full flexibility. You can shift its placement to complement other visual elements or eliminate it for a more minimal, distraction-free interface. The sensor panel file includes two distinct background images—one designed specifically to complement a tinted glass panel, enhancing its visual integration and readability. Video Demo of the Sun and Moon rotating: https://youtube.com/shorts/nUo4jKHRtmY?feature=share Panel Skin Video: https://www.youtube.com/watch?v=lgSu7qwFos8 Note: Requires AIDA64 version 7.70.7500 or Beta 7.99.7829 or above. Visit BHSYSensorPanel for more info. and designs.

-
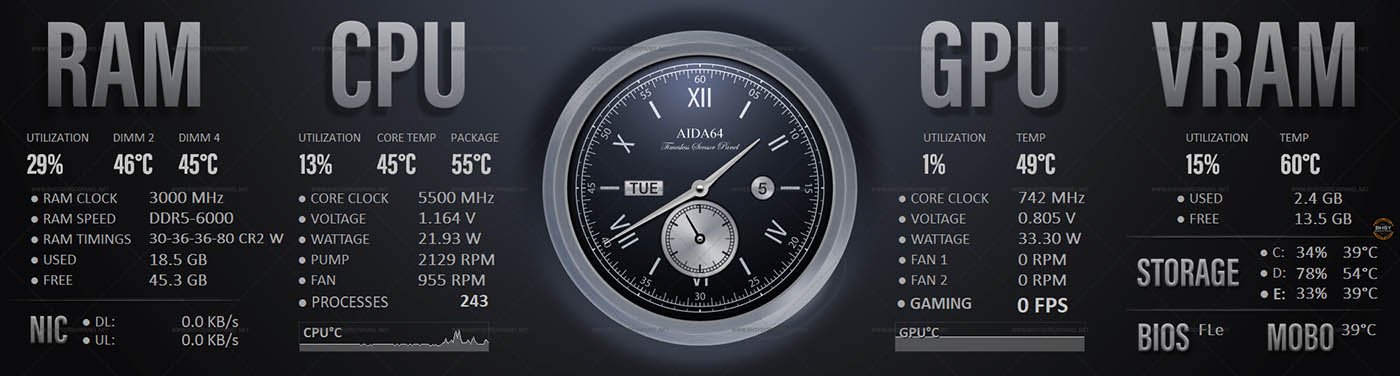
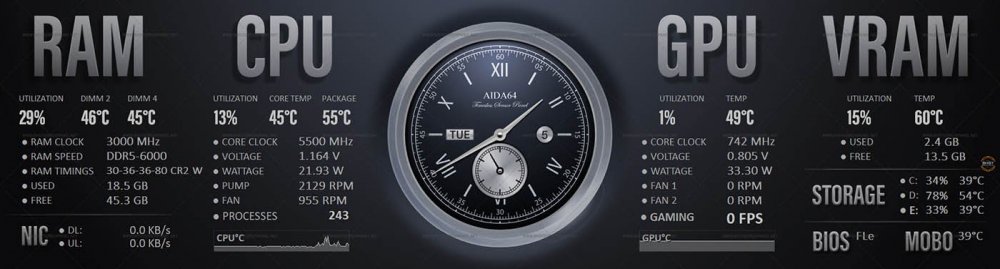
65-AIDA64 Vintage Timeless Sensor Panel. Available in 1920x515 / 1920x480 / 480x1920 / 515x1920 / 1280x800 / 800x1280 Note: Requires AIDA64 version 7.70.7500 or Beta 7.99.7829 or above. Visit BHSYSensorPanel for more info. and designs.
-
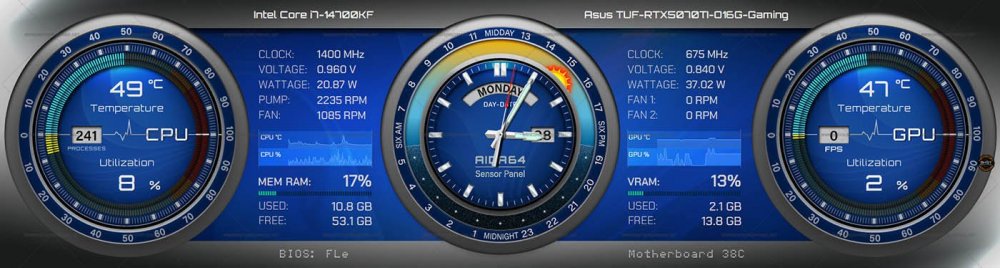
64-AIDA64 System Sensor and Dial Clock with Sun & Moon 1920x515 Video Demo of the Sun and Moon rotating: https://youtube.com/shorts/pW8hakdqbT0?feature=share Panel skin video: https://youtu.be/LGY_BsDRcuA Middle Section Elegant 24-hour radial clock with hour ticks and sun/moon icons. Displays full weekday and time info in the center for quick-glance readability. Ambient indicator adds context and gives a nice nod to minimal environmental awareness. Visit BHSYSensorPanel.Net for more info. and designs.
-
63-AIDA64 Radiant Colors Sensor Gauge Panel Skin Available in 1920x515 / 1920x480 / 480x1920 / 515x1920 Visit BHSYSensorPanel.net for more information and designs.
-
I finally received the PH cable, but it was the wrong size.😅 Anyway, I finally found out what was causing my computer to wake up from sleep mode when using the TURZX display. I came across this article and used the command prompt: powercfg -devicequery wake_armed, which listed the following devices that wake up my computer, as shown in the screenshot below. The weird thing is that none of these devices wakes up my computer before I enable the tulcd, unbelievable 🤔. After disabling the 'Allow this device to wake the computer' from the listed devices, my computer continues to stay in sleep mode even with the tulcd enabled.😊 Now, I am unable to wake up my computer using my wireless keyboard and mouse; instead, I use the power button to wake up my computer.😅
-

Request sensor update for ASUS TUF Gaming GeForce RTX 5070 Ti
BHSY replied to BHSY's topic in Hardware monitoring
Noted. Thanks! -
Request sensor update for ASUS TUF Gaming GeForce RTX 5070 Ti
BHSY replied to BHSY's topic in Hardware monitoring
Hi @Fiery, I am unable to stress test my GPU using the System Stability Test again under version 7.70.7500. GPU is 'ASUS TUF Gaming GeForce RTX 5070 Ti 16GB GDDR7 OC Edition'. Updated my GPU to the latest driver 1-2 days ago. -
Thank you for the testing. I had placed an order for PH to 9-pin USB cable and let's see if the device will prevent my system from waking up from sleep mode. In the meantime, I'll exit/close AIDA64 program to shut down the device. I'll let you know once I recive the new PH cable and tested it. Thank you.
-
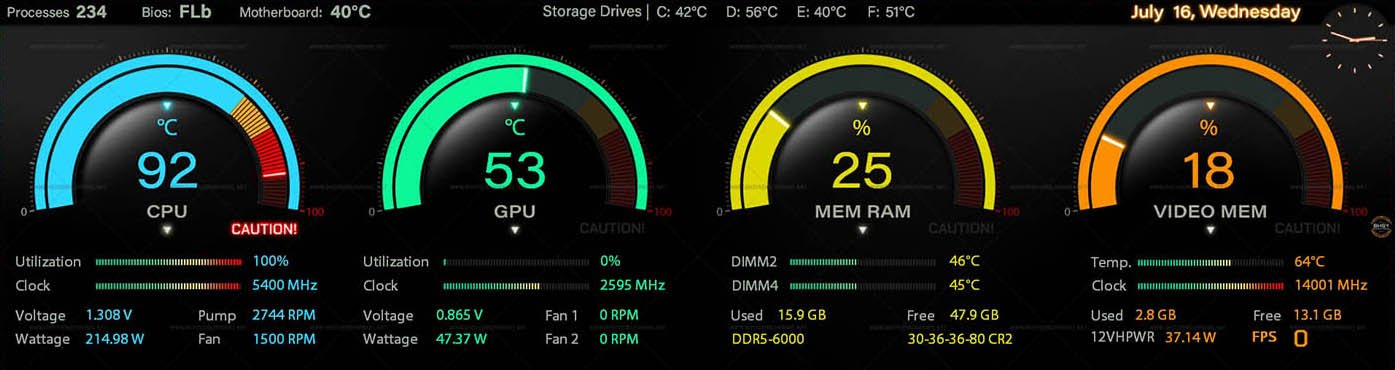
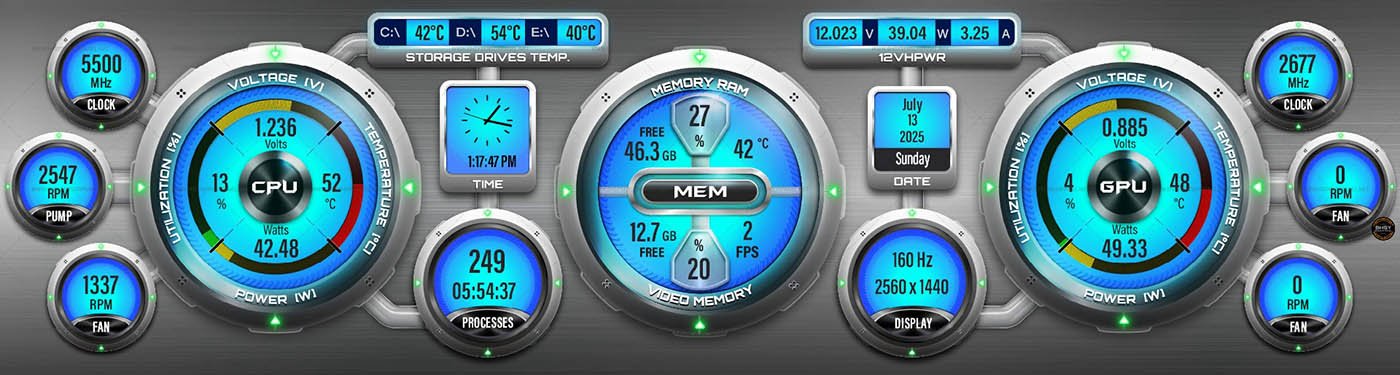
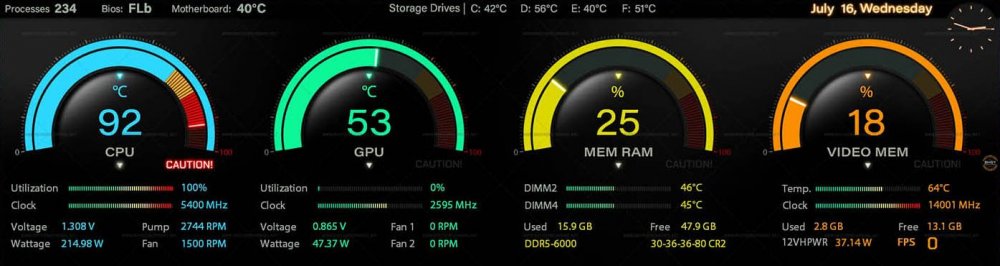
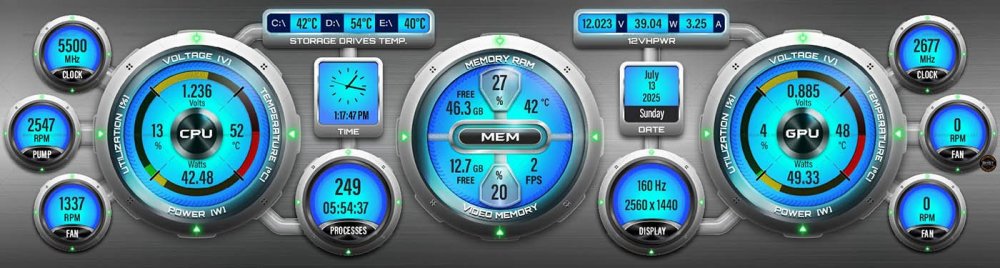
62-AIDA64 Cryo Circuit Metallic Silver-Gray Panel Skin Available in 1920x480 and 1920x515 Left Side Readouts CPU Utilization, temperature, voltage, wattage, clock, pump, and fan. CPU active processes and uptime Storage Drives temperatures x 3 Time with moving hours, minutes, and seconds needles. Right Side Readouts GPU Utilization, temperature, voltage, wattage, clock, and fans. Display refresh hertz, and monitor resolution GPU 12VHPWR voltage, wattage, and amps Date Center readouts Memory utilization, temperature, and free memory size. Video Memory utilization, temperature, and free memory size. Like the panel --> Visit BHSYSensorPanel for more info. and designs.
-
Hi @Fiery, any updates on the 1st Gen TURZX issue?
-
Hi @Fiery, I'm using the Gen 1 TURZX Turing smart screen, 1920x480, and I'm facing the same problem again. I haven't used it for a while until today, and just changed to a new cable, a USB Type-C to USB 9-pin cable, because either the old PH cable was defective or the PH port was faulty. The device connection was successful and displayed the sensor perfectly, but the device keeps waking up my system as soon as I put Windows to Sleep. Even using a USB Type-C to USB Type-C. Attached is the usbdump.txt file for your investigation. Thank you! AIDA64_usbdump.txt
-
I like this idea too. With this feature, I can easily select or add my most frequently used fonts without browsing through the drop-down list or keying in the first few characters to find the font names.
-
REQUEST NEW FEATURE - Date in the Custom Gauge
BHSY replied to Surjeet's topic in General Discussion
Thank you for your compliment.🙏 I lower the SensorPanel update rate to 500 ms or 200 ms, and it helps. Thank you so much🙏. Now, everything looks perfect.👌😊. -
REQUEST NEW FEATURE - Date in the Custom Gauge
BHSY replied to Surjeet's topic in General Discussion
20250630_174221.mp4 @Fiery The minutes and seconds sync very well with my OS time. However, for the second, some of them will skip a second, even using 'Simple Sensor Item'. For example, from 24s it jumps to 26s, skipping 25s. Please watch the above video. Is there any way to improve the seconds without skipping? It's ok if there's nothing that can be done about it. I'm quite satisfied with how the new time and date gauges work. AIDA64 is the best customization sensor panel. Thank you to you and your team for making this possible. Well done!🥰💖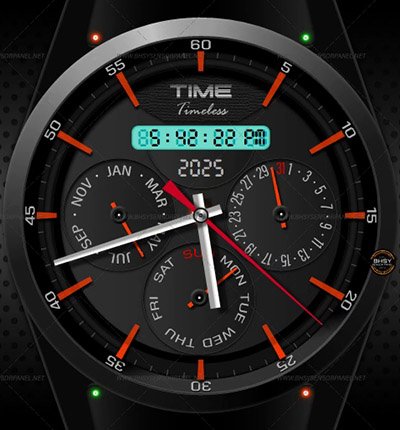
-
REQUEST NEW FEATURE - Date in the Custom Gauge
BHSY replied to Surjeet's topic in General Discussion
I forgot to mention that the new time gauge did not show the default values when I selected it. Can you show the default value? Thanks. -
REQUEST NEW FEATURE - Date in the Custom Gauge
BHSY replied to Surjeet's topic in General Discussion
Thanks. I got it.🙏 I try playing with the states, and it depends on where I start. Either I start at 12:00 or 1:00. For the hours, I might use the old time gauges that use 4 sensors and 180 images. Almost accurate. Tomorrow, I will try testing using more images on the new hours gauge type. hours (1-12): states 0-11 (12 images) - starts from 1.00 - 12.00 hours (0-23): states 0-23 (48 images) - starts from 12.00 and ends at 11.00. 24 images (day) + 24 images (night) The best part is I can now show seconds Hands on my clock, and it moves the same as the Windows 11 clock seconds.💪And I only need 1 sensor for minutes. Awesome! 😃 minutes: states 0-60 (61 images) - start from 12.00 to 12.00 second: states 0-60 (61 images) - start from 12.00 to 12.00 Thank you! -
REQUEST NEW FEATURE - Date in the Custom Gauge
BHSY replied to Surjeet's topic in General Discussion
@Fiery@Surjeet How many images must I use for hours, minutes and seconds? Also, what are the min/max values used for each of them? I can't seem to get it to work unless I use the old time gauges using 4 sensors for hours (180 images), and 15 sensors for minutes (60 images). This method is closer to accuracy. I can get the seconds to work using 61 images; the min/max value is 0 and 61, but sometimes it skips a second. Thanks. -
I tested the custom color renaming and deletion. There were no issues on my side. Now the color picker is completed and perfect.👍 Thank you! 🙏
-
Ok. Thank you!
-
Hi @Surjeetplease take a look at my screenshot below. This is how I name my file. In the past, I did not add a zero in front of the numbering. When I used the new (n state), a few images were missing from the states. After discovering one of the posts from @Fiery a while back, we need to add a 0 in front of the numbering, except for 100. Also, the numbering will follow the states number. Let's say you wanted to add _02.png but you accidentally selected and added a _03.png, it will automatically be added to the states 03 instead of states 02 The state 02 will show as empty unless you add in the _02.png. In the old (16 states), it is easy to miss out 1 of the images. As per @Fiery instruction, you need to add _nn.png or -nn.png. Not very good in explanation, I hope you understand what I'm trying to explain.
-
I support this too! Hope it can be done. Thanks!