


Arctucas
-
Posts
310 -
Joined
-
Last visited
-
Days Won
5
Content Type
Profiles
Forums
Events
Posts posted by Arctucas
-
-
We've implemented Uncore clock measurement for 1st Generation Intel Core processors. It is displayed as North Bridge Clock on the Computer / Overclock page. It can also be put on the OSD, Sidebar, Logitech LCD, etc.
Please upgrade to the latest beta version of AIDA64 Extreme Edition available at:
http://www.aida64.com/downloads/aida64extremebuild1369s7dq4xmycrzip
After upgrading to this new version, make sure to restart Windows to finalize the upgrade.
Let me know how it works.
Thanks,
Fiery
As usual, it works perfectly.
Thank you, and keep up the excellent work!
-
I have an APC UPS, and I noticed that the PowerChute software can read and display the amount of power being drawn through the UPS.
Would it be possible to incorporate this feature (for those who have an APC UPS) into AIDA64?
Thanks.
-
Since you typically want to customize every items you add, and place them at individual (X,Y) position on the panel, I don't think a mass addition feature would work well in the real life. Even if you added a lot of items at once, you would still need to go through them one by one and alter them, move them, etc...
Thank you for the prompt reply.
Actually, as you already have the sensors grouped quite well, I believe that, personally, I would leave them as is once placed onto the sensor panel.
For me, this would save a great deal of time.
However, I understand your position.
While the new Sensor Panel appears to be a great addition to AIDA64, having briefly tried it out, perhaps I will simply continue to use the OSD as it serves the purpose I use it for quite well.
Thanks for continuing to provide an excellent application.
-
Fiery,
Thanks for the update.
I will still need to add sensor items one at a time, correct?
Will adding multiple items at once be a feature in upcoming releases?
-
I was wondering if it is possible to have the Uncore frequency displayed in the OSD?
I have an eVGA X58 (Classified 3) motherboard.
I am able to check the Uncore in ELEET, but it would be nice it AIDA64 could also display it.
Thanks
-
Fiery,
Is there any way to select all the sensor panel items at once, as you can with the OSD by highlighting the first and then holding shift while highlighting the last?
Or must we add the items one-at-a-time?
Thanks.
-
Arctucas, do you see any difference in the CPU tests?
my cpuphotoworxx, zlib and aes results have increased as well
I see negligible differences in the CPU test, probably normal variation.
-
This is quite interesting.
I ran the Memory and Cache benchmark with CxE on Auto and again with it disabled:
CxE Auto
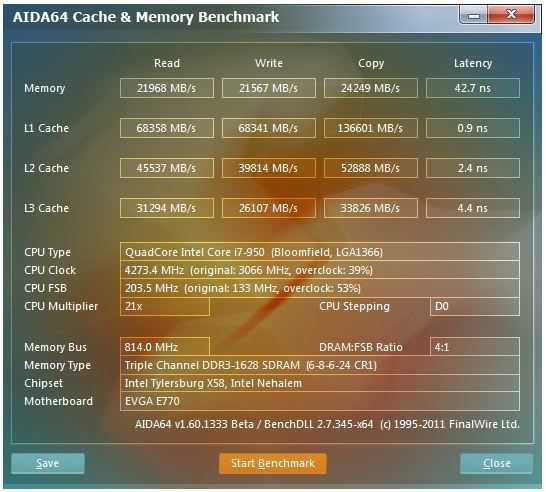
CxE disabled

-
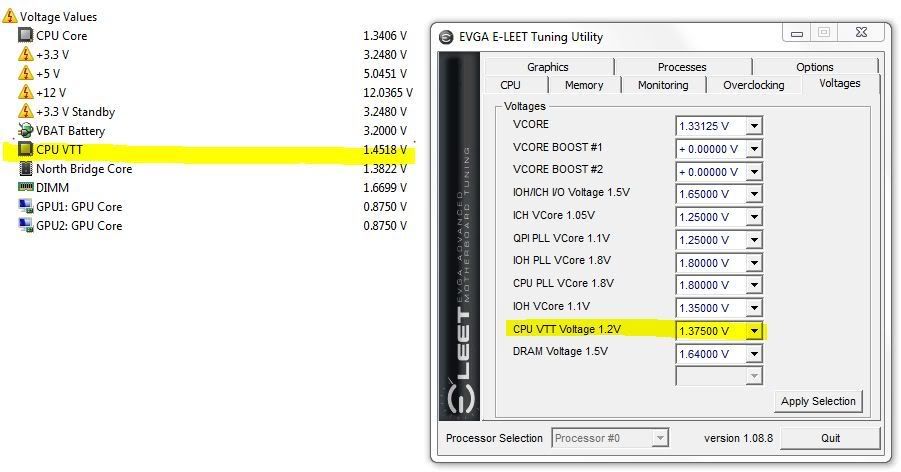
Please send a screen shot that shows the measured voltages in E-LEET next to AIDA64 Sensor page.
And please also copy-paste an ISA Sensor Dump

Thanks,
Fiery
I apologize, I mistakenly thought I was on the Monitoring page in ELEET.
They do show the same.
Thanks.
-
I have the CPU VTT set to +175mV in BIOS, with the VCore set to 1.33125V.
However, AIDA64 appears to be mis-reading the voltage:
-
I would also like to see some option that would allow display of all my OSD without the need to make the text uncomfortably small.
I currently am using Georgia font at text size 10 on a Samsung 305T+ (30 inch monitor) with the resolution at 1920x1200, the taskbar hidden, and I lose the top or bottom line.
-
Thanks for that important question: No the compatibilty flag is not set in the program-properties.
What I see in AIDA64 under Opering System is this

Friendly advice; edit your post and remove the product key.
-
Thanks for the update.
-
Using 10.1.0.1008, four G2 SSD in RAID0, no issues.
-
I'm afraid the current solution is the best we can do
That board (and actually all EVGA X58 chipset based boards) uses a shared register for NB and CPU temperature, and uses a special register switch to switch between the two readings. AIDA64 does everything "by the book", but still, the switch sometimes does not happen, and so the temperatures got mixed up (e.g. CPU temp is shown as NB temp, and vice versa).I see, thank you for the info.
-
Fiery,
Thank you.
It is sort of like GPU-Z.
-
Fiery,
I noticed "GPU MC Utilization" and "GPU VE Utilization" sensors have been added.
Could you explain what they are actually monitoring?
Thank you, and keep up the excellent work.
-
We've managed to stabilize the NB and SB temperature measurement on your motherboard.
Please upgrade to the latest beta version of AIDA64 Extreme Edition available at:
http://www.aida64.com/downloads/aida64extremebuild1165vs6mnwy3qxzip
After upgrading to this new version, make sure to restart Windows to finalize the upgrade.
Let me know how it works.
Thanks,
Fiery
Fiery,
I presume you were replying to the OP, however, I continue to have the fluctuating NB temperature on my eVGA Classified 3, even with the 1165 BETA.
Is there anything you can do to correct it?
Thanks.
-
The "Remaining Battery Lifetime' did change when unplugged, thanks for the tip!
Although the 'Full Battery Lifetime' remained Unknown. I suppose my UPS is one of the ones that does not report that.
-
As I remember everest can show wear level for APC UPS, but aida64 doesn't show this anymore. I have an APC Backup UPS 700ES connected on usb port.
I did not know that, I wonder if it works for my Back-UPS RS 1500 LCD?
The UPS appears in the Computer/Power Management/Battery Properties page, and under Power Management Properties/Full Battery Lifetime is says 'Unknown', Remaining Battery Lifetime also says 'Unknown'.
Anyway, here is mine:
Field Value
Power Management Properties
Current Power Source AC Line
Battery Status 100 % (High Level)
Full Battery Lifetime Unknown
Remaining Battery Lifetime Unknown
Battery Properties
Device Name Back-UPS RS 1500 LCD FW:839.H10 .D USB FW:H10
Manufacturer American Power Conversion
Manufacture Date 1/11/2010
Serial Number 3B1003X07215
Unique ID 3B1003X07215 American Power ConversionBack-UPS RS 1500 LCD FW:839.H10 .D USB FW:H10
Battery Type Rechargeable PbAc
Voltage 27400 mV
Power State AC Line
-
Not to threadjack, but I have a similar issue with the NB temperature on my Classified 3.
It will jump from somewhere in the 20s to somewhere 60-70, depending on the system load, every few seconds.
I do not have any other monitoring software active.
-
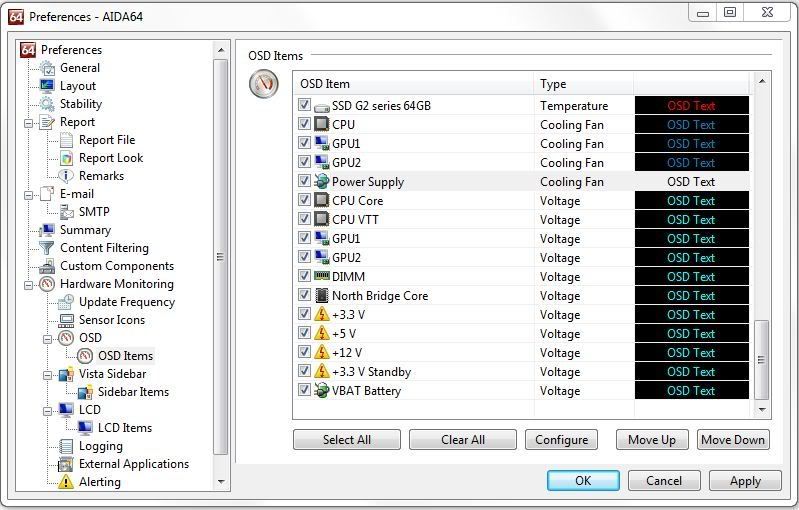
Since I have the ability to change the text of any sensor displayed by the OSD, why not allow us to change the icons as well?
For example, the icon displayed for the "Power Supply" cooling fan is a battery, and I also see the same icon used for the VRM temperature sensor.
I would like to be able to make a fan sensor display a fan icon or, since I am currently using that fan header for my RAM cooling fan, the memory icon.
The VRM could show a DIP icon like the Northbridge.
-
AIDA64 also says I have a "Power Supply" fan sensor.
However, I assure you that my AX1200, like the HX1000, has no fan speed signal to the motherboard (unless your PSU has been custom modified). I connected additional NB fans to that header.
-
Fiery,
Thank you, it works perfectly!
Also, great job on adding the other sensors, keep up the excellent work.
Does AIDA64 need a "Check for Updates" feature?
in General Discussion
Posted
I did not think there was much that could make AIDA64 better than the excellent application it already is, but a 'Check for Updates" feature would indeed be welcome.