Soul--Reaver
-
Posts
23 -
Joined
-
Last visited
-
Days Won
1
Recent Profile Visitors
2582 profile views

Soul--Reaver's Achievements
")


-
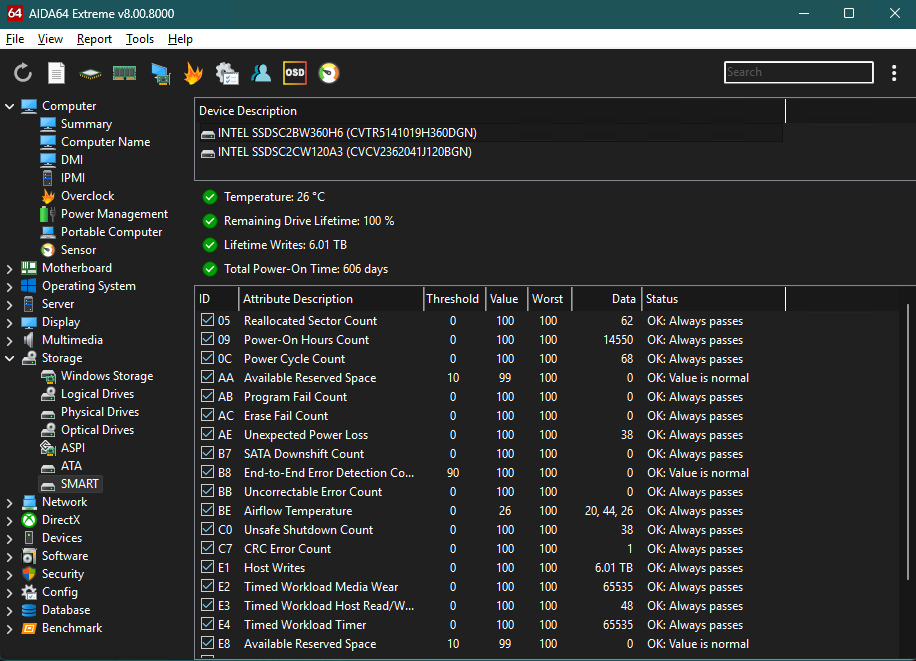
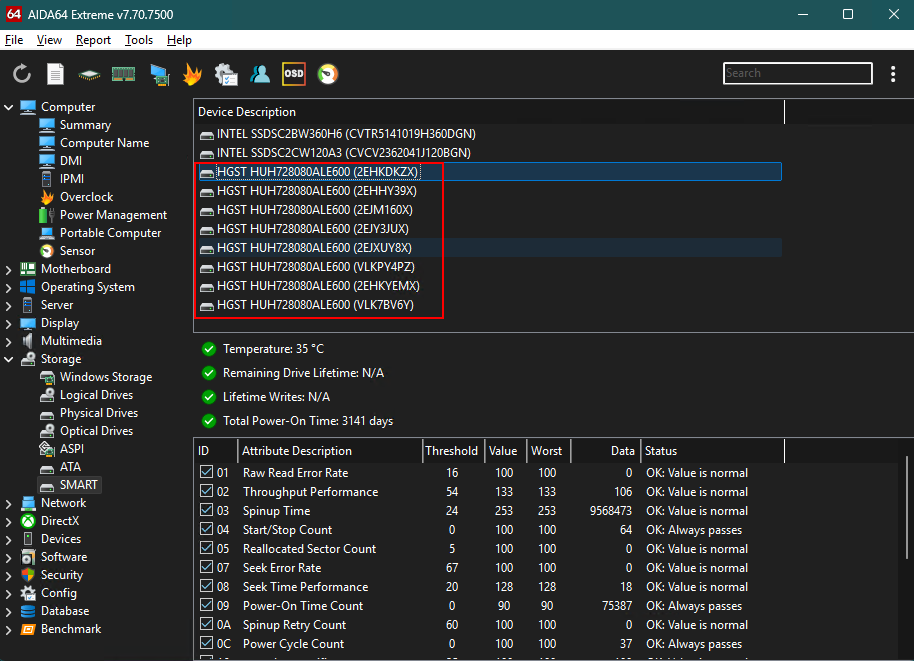
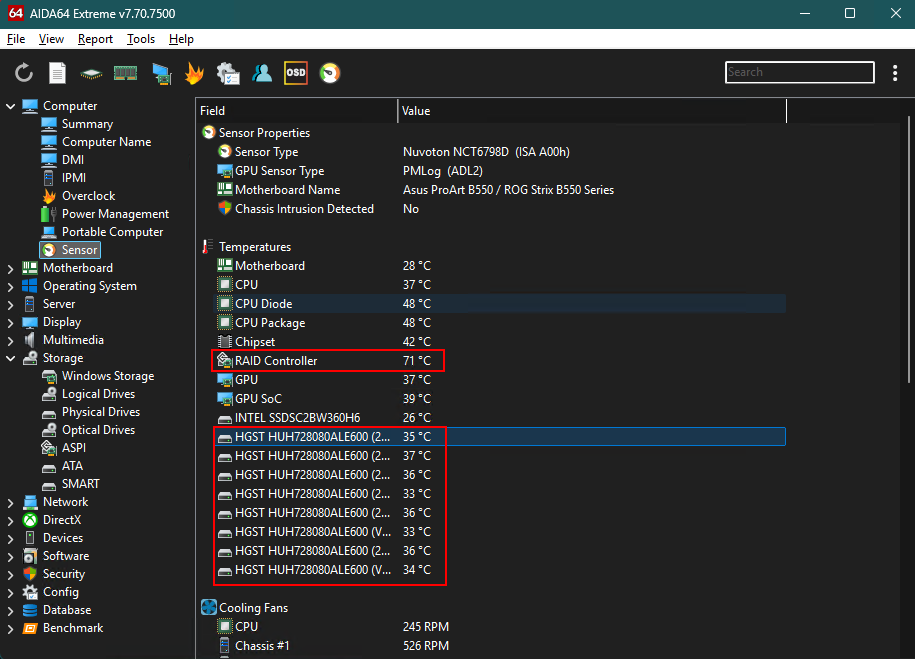
System: AMD 5700G, Asus B550-F, Adaptec ASR 8805 raid card, 8 * HGST HUH728080ALE600 Problem: Aida64 7.70.7500 was able to retrieve, among other things, the RAID and Smart information of the Adaptec ASR 8805. The necessary stability checkmarks are turned on but Aida64 8.00.8000 and later versions do not show the Smart data of the disks connected to the Adaptec ASR 8805. See the screenshots of the 2 Aida64 versions running the same aida64.ini file and the missing information. raiddump_aida64 8.00.txt raiddump_aida64 7.70.txt smartdump_aida64 8.00.txt smartdump_aida64 7.70.txt
-
Hi Aida64 team, I'm running Aida64 6.88. This concerns the temperature readings and the best core readings. I've read on the forum that the difference in temperatures reported by Aida64 and Ryzen Master is because Ryzen Master averages/processes the data while Aida64 does not. I think what Aida64 does is the correct decision here. But if the Ryzen Master reports 10 degress higher temperatures that would mean significant amount of temperature spikes which are not visible in Aida64 even with measurements over time using the system stability test. But why is a program like Clocktuner/Hydra able to report per CCD/CCX temperatures and Aida64 is not? Clocktuner required Ryzen Master in the past so the source of data is probably the same. I would like to see the per CCD/CCX temperatures in Aida64 as well. I would also like to see the core quality results in AIda64 if possible. Kind regards Swen
-
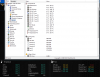
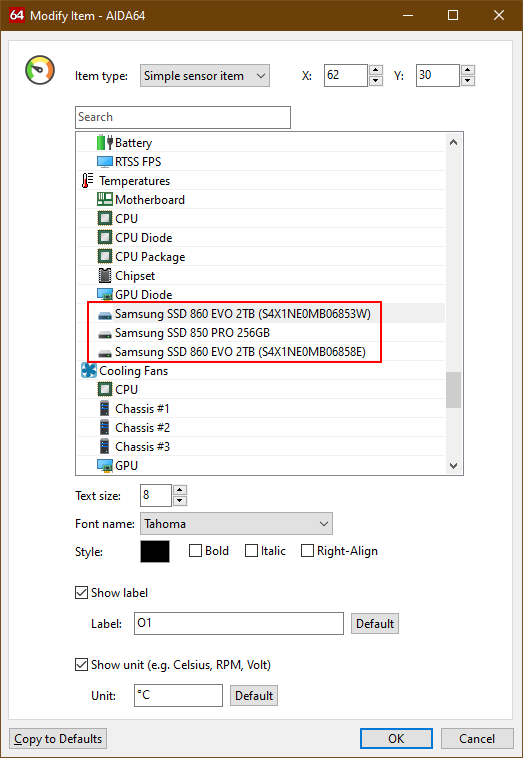
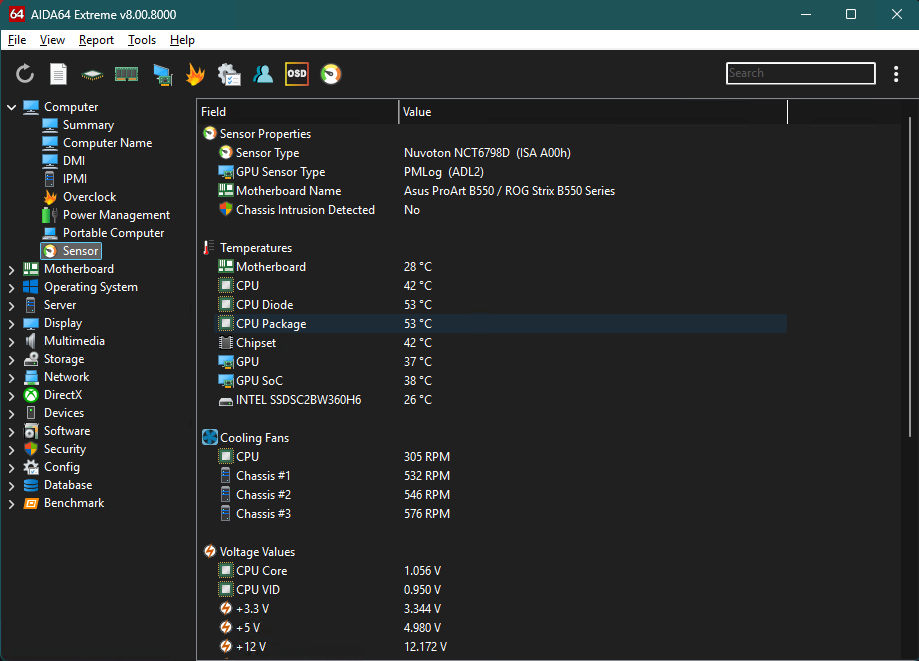
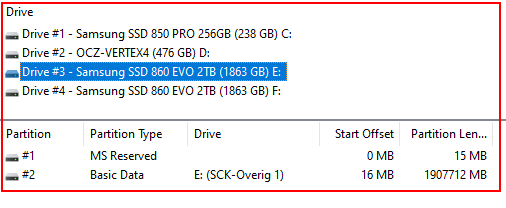
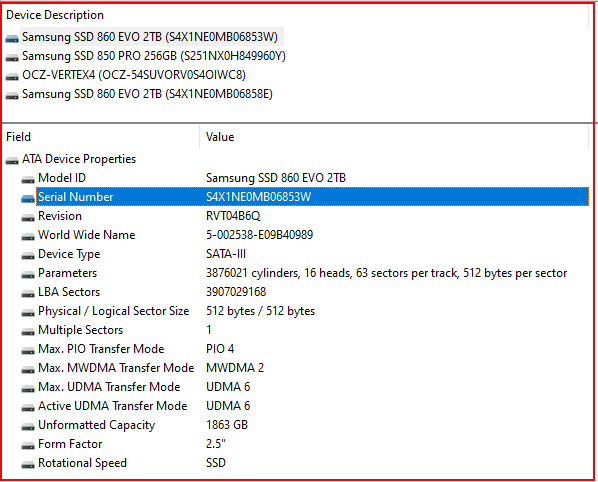
Chipset temp now available in 6.32 Thanks "Physical drives" does not show a serial number (or other unique identifier). So no idea which drive its related to. You tell me whether you can figure out which of the two Samsung SSD 860 EVO 2TB is connected to which partition. I only have the serial number as a starting point since thats the only unique value in the sensor items list (see the last screenshot) Storage / Physical Drives Storage / ATA Sensor items list

-
Hi Finalwire I've got the following hardware AMD Ryzen 7 5800x ROG STRIX B550-F GAMING 2 * Samsung SSD 860 EVO 2TB First issue In the BIOS of the motherboard i can see a chipset temperature. Aida64 does not show this temperature in the sensors list. Second issue I've got two Samsung SSD 860 EVO 2TB. Aida64 identifies them in various places as "Samsung SSD 860 EVO 2TB ([serial number here])" (among others the "LCD items" settings page) I want the temperature of the SSD with drive letter E: shown first, followed by the second one with drive letter F: in the LCD items. Now i want to know which SSD with that particular serial number contains which partition. So far i have not found anyway for Aida64 to tell me this. Aida64 does not seem to have a relation between the physical drives and the containing partitions Hope someone can help with these questions
-
bug Hardware monitoring shows incorrect CPU util percentages
Soul--Reaver posted a topic in Bug reports
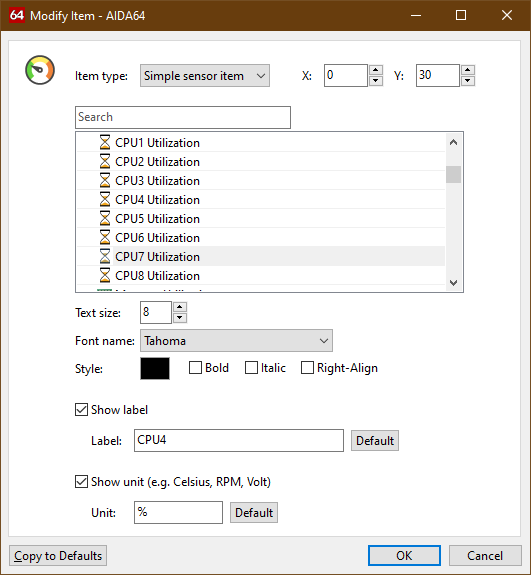
System: Asus Sabertooth Z77 Intel 3770K Nvidia Geforce 1070 Logitech Keyboard G510S Aida64 version: 6.25.5400 I'm using the LCD in my keyboard and Aida64 to monitor certain system values. I've noticed that the CPU util percentages are not correct on the LCD display. The most obvious is that when the system is completely idle (CPU util.png), The LCD will never show a lower number then 28% for CPU7 Utilization (LCD CPU util.png) on the LCD. The other numbers are also weird or incorrect but that is more of a feeling i have. The other CPU utils feel weird because i never see 1% or 2%. It's always 10%, 11%, 12%, 14%, 22%, 28% etc. but never below 10% except 0% As shown in "CPU util.png" Aida64 is capable of getting the correct percentages, it just does not show them on the LCD display in my keyboard Kind regards Swen Kruiper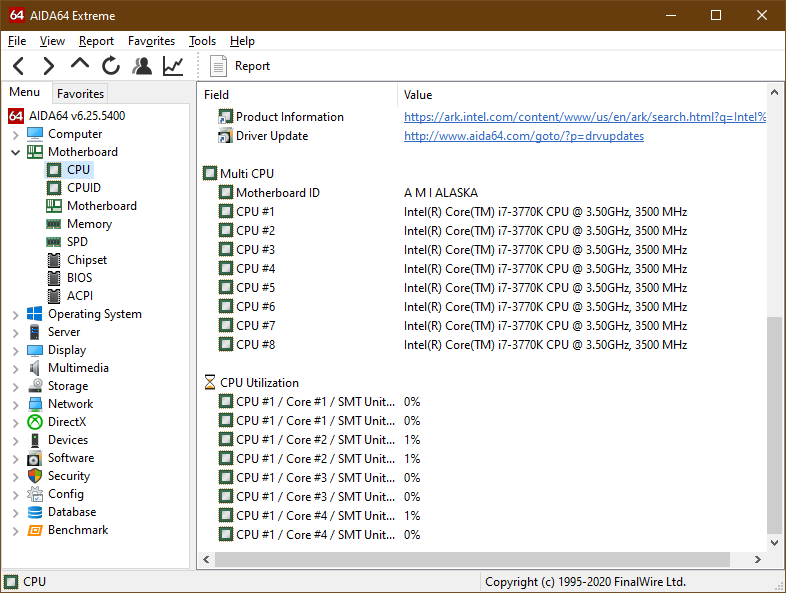
-
AIDA64 compatibility with AMD Ryzen processors
Soul--Reaver replied to Fiery's topic in General Discussion
When will we start seeing Ryzen results in the benchmarks? I want to compare my current processor to a Ryzen one but i could not find any Ryzen results in Aida64 5.92 -
I don't know GlobalMemoryStatusEx returns but it seems thus at the moment for all 3 values (total, used, free) Physical memory = physical memory (go figure ) Swap space = Physical memory + Paging file Virtual memory = Physical memory + Swap space Virtual memory seems to actually count physical memory twice based on above assumptions. Is there any way to create a memory status dump like the sensor dump and raid dump in aida64?
-
(8) Though i can understand Fiery, i do think its a shame. I really hate AI Suite but cannot get rid of it since there isn't a program available that can replace it. Speedfan can only see a small portion of the temperature sensors on my Sabertooth Z77/Z87 and is unable to control the assistant fans. Aida64 can see all the temperatures and fans but is missing the functionality to control the fans.
-
I haven't disabled any services. Only the AI Suite task in the task scheduler has been disabled
-
I checked in my Thermal Radar 2 in Ai Suite and its impossible for me to change temperature labels except for the T_Sensors By default my motherboard came with the 0801 bios, which I immediately updated to the 1007 bios. For AI Suite was also a newer version available from the asus website compared to the one that came on the cd with the motherboard. So its possible one of them changed the labels. Though i wouldn't know for sure unless i downgraded one or both of them
-
Chassis fan 4 is monitored properly now I've got Asus AI Suite III (Asus Sabertooth Z87). I've got the default labels for all of them except for the T_Sensor1 i mentioned earlier in the sidenote Also it seems it is not possible to change the temperature labels except for the T_Sensors. I changed T_Sensor1 back to its original name and the problem still persists
-
Sabertooth X79 Chassis Fan Speeds
Soul--Reaver replied to PharmboyNorth's topic in Hardware monitoring
You know that's a funny story. I've got an Asus Sabertooth Z77 and Z87 motherboard and would love to dump AI Suite II and III but can't because speedfan does not fully support the sensors and fans. It can only see a small portion of the temperature sensors and cannot control or monitor the Assistant fans. So i'm stuck between a rock and a hard place Lucky for me Aida64 and its support staff are excellent so i make do with Aida64 and AI Suite though i really wish i could dump the latter -
New GPU VRM Items with latest beta + nvidia 320 series driver
Soul--Reaver replied to D-E's topic in Hardware monitoring
You know, i never knew i was missing info about my nvidia GTX card... I learn new stuff about Aida64 every day and every day the program just keeps getting better Apparently i'm having the same issue. Here is the dump from my card. Don't know if it matters but recently i applied a Asus UEFI VBIOS update for my GTX 670 DCII. nvidiasmbusdump.txt -
Alright done that (didn't know Aida64 had that right click menu. Pretty nice stuff in it ) Anyways here is the stuff as requested. I'm running Aida64 3.00.2514 Beta ecdump.txt isasensordump.txt
-
I've got an Asus Sabertooth Z87 motherboard This beta update adds various temps that were unavailable before. Nice But there are still some issues: Chassis fan #4 is incorrectly identified as a CPU OPT fan (i do not have a CPU OPT fan) Several temperatures are still missing (the sabertooth series has a decent amount of these) See attached screenshot Sidenote: AdaptecRaid5805 = T_Sensor1