Squall Leonhart
-
Posts
386 -
Joined
-
Last visited
-
Days Won
3
Content Type
Profiles
Forums
Events
Everything posted by Squall Leonhart
-
could work on a G15 as well, each page button switches between 2 tabs?
-
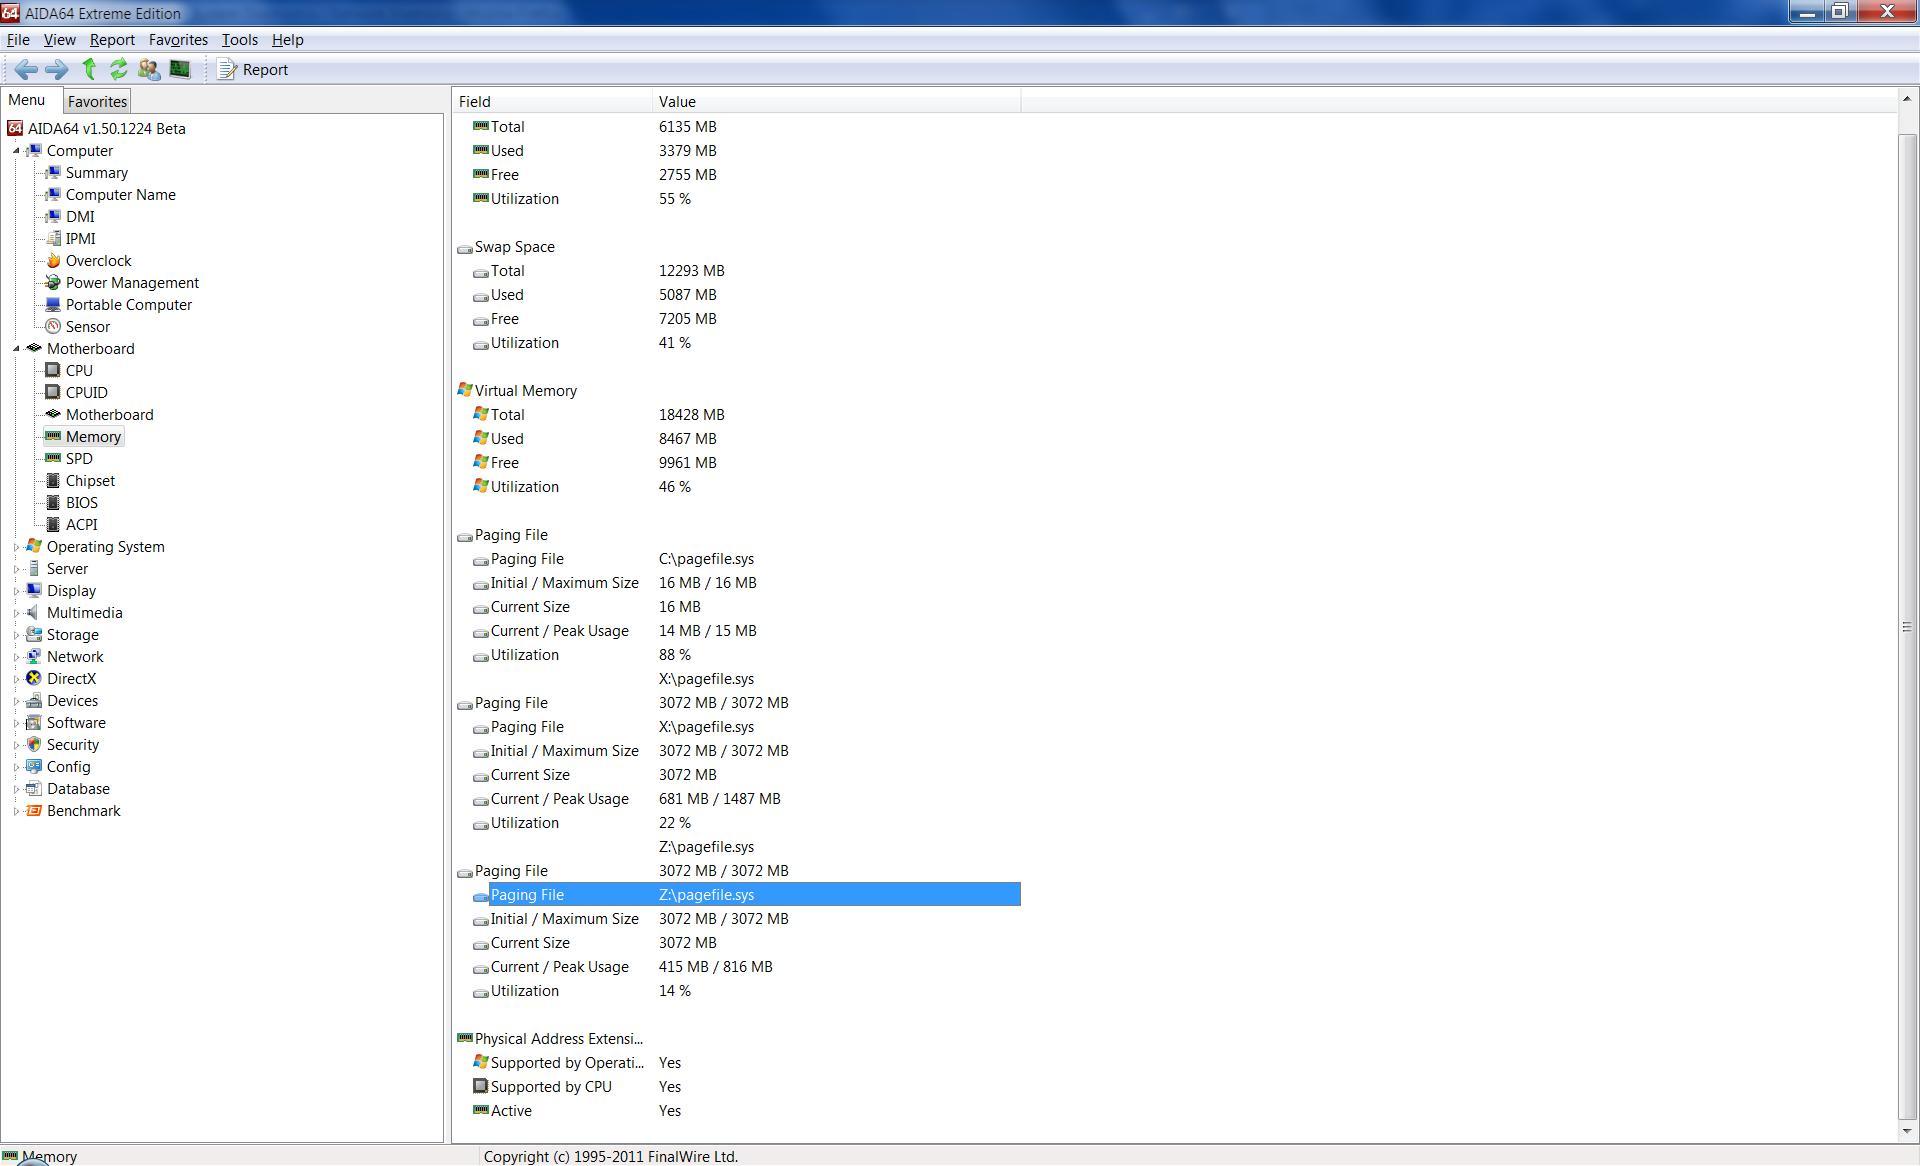
Page file details may randomly glitch
Squall Leonhart replied to Squall Leonhart's topic in Bug reports
only the G15 LCD. And i have been running without problems while not leaving AIDA sitting on the memory pane. If i change it back to the Memory pane, it will eventually either crash or raise an out of thread resources error, and performance monitor will show that 111 threads are in use. Normal usage is 4 threads. -
Detect Sandy Bridge - Series 6 Express degradation
Squall Leonhart replied to Beat's topic in Brainstorming
can be done via smart. -
Wrong readings on GeForce GTX Texel Fillrate & System Swap & VM
Squall Leonhart replied to javanse's topic in Bug reports
Texel Rate is most certainly fixed -
Page file details may randomly glitch
Squall Leonhart replied to Squall Leonhart's topic in Bug reports
It seems, as long as i leave the Memory pane selected, it will crash or report a threading error after a period of time (average is around 45min) if i switch to any other pane there's no problem and aida works perfectly normally. -
before you bag on the AIDA64 customer service, try contacting gigabytes or asus's.
-
Page file details may randomly glitch
Squall Leonhart replied to Squall Leonhart's topic in Bug reports
thread creation error is still occuring It only appears if aida64 is running (from the tray or otherwise) whilst sitting on the Memory page. if i change the page to any other the issue does not occur. -
Wrong readings on GeForce GTX Texel Fillrate & System Swap & VM
Squall Leonhart replied to javanse's topic in Bug reports
apparently, the Texture fillrate is also incorrect, on my 275 it should be between 46000 and 54640 Mtexels/sec (clock dependant) but aida displays it as over 80,000Mtexels/s when ramped up to full clocks. -
Aida64 freezes every ~ 20 sec (Asus P5Q RAID)
Squall Leonhart replied to Deivs's topic in Bug reports
it seems restricted to certain hardware combinations, i've not been able to reproduce it on my ICH10 SATA so far. -
Page file details may randomly glitch
Squall Leonhart replied to Squall Leonhart's topic in Bug reports
Windows 7 limits the use of the page file a great deal, it will allow system ram to fill up completely before swapping inactive but loaded content to paging. -
yep, it seems it doesn't display PCB or VRAM temps.
-
the current motherboard used has them disabled.
-
Page file details may randomly glitch
Squall Leonhart replied to Squall Leonhart's topic in Bug reports
no page, it was running in the tray. I think it may have been colliding with the threads created by a facebook app called cityville, because it only started occuring every 15 mins while that was running, and i haven't had it since closing the app. ok, no apps running this time and it still happened. Happened again Checked the threads count this time, it was at 111. restarted Aida64, and started with 4 threads, and has started growing.. i expect it might be coinciding with the point in which it would start displaying the duplicated lines in previous builds? -
Page file details may randomly glitch
Squall Leonhart replied to Squall Leonhart's topic in Bug reports
it appeared immediately for me, now i will wait and see if it doubles up still. update getting thread creation errors in this new build i have the g15 LCD enabled as well.
-
Page file details may randomly glitch
Squall Leonhart replied to Squall Leonhart's topic in Bug reports
Yes, it occurs both in Build 7600(SP0) and 7601(SP1). It will not immediately display, but leave aida64 open for some time and the usage's will eventually show up. then double up.... -
Motherboard\Memory Section partial redesign
Squall Leonhart replied to tlen's topic in Brainstorming
so fiery knows that some people oppose the idea. -
Temp of RAID disks Disappear Periodically
Squall Leonhart replied to pbcopter's topic in Hardware monitoring
hwmonitor and apps based off it cause all sorts of hell to other temp monitoring apps. -
Temp of RAID disks Disappear Periodically
Squall Leonhart replied to pbcopter's topic in Hardware monitoring
you don't happen to have HWMonitor open do you? -
asus bios's allow you to specify the amount of cores to enable.
-
Motherboard\Memory Section partial redesign
Squall Leonhart replied to tlen's topic in Brainstorming
actually, no its not. but since you think it is, im not going to explain to you why it isn't. -
during extended aida64 usage, the page file details in the memory section may double up the info displayed... for instance, it displays the used/max items twice.

-
been trying to get hold of orbu2k to get him to update his nvidia gadget to use global mutexes but cannot find his email anywhere. keh.
-
EVGA Precision 2.0.2 has been released This should make Aida64 safer to run alongside precision yes?
-
must be the intel drivers strangely though, i don't have any issues in games or music with the default polling rate, and using IRST 10 in ahci mode.
-
AIDA64 stops responding when generating report
Squall Leonhart replied to IreMaster's topic in Bug reports
one of your input drivers, possibly touchpad or multimedia input driver needs updating.