
Leaderboard


Popular Content
Showing content with the highest reputation since 07/27/26 in Posts
-
Wrong thread! This forum thread is called "Share your Sensorpanels", not: give me money and i do the job and change the resolution. There is a specific sub-forum for stuff like this, if you want to sell your sensorpanels. Use at least the PM function in this forum.1 point
-
why is the scale function not available on stable version but on beta's? Would like it to be always available.1 point
-
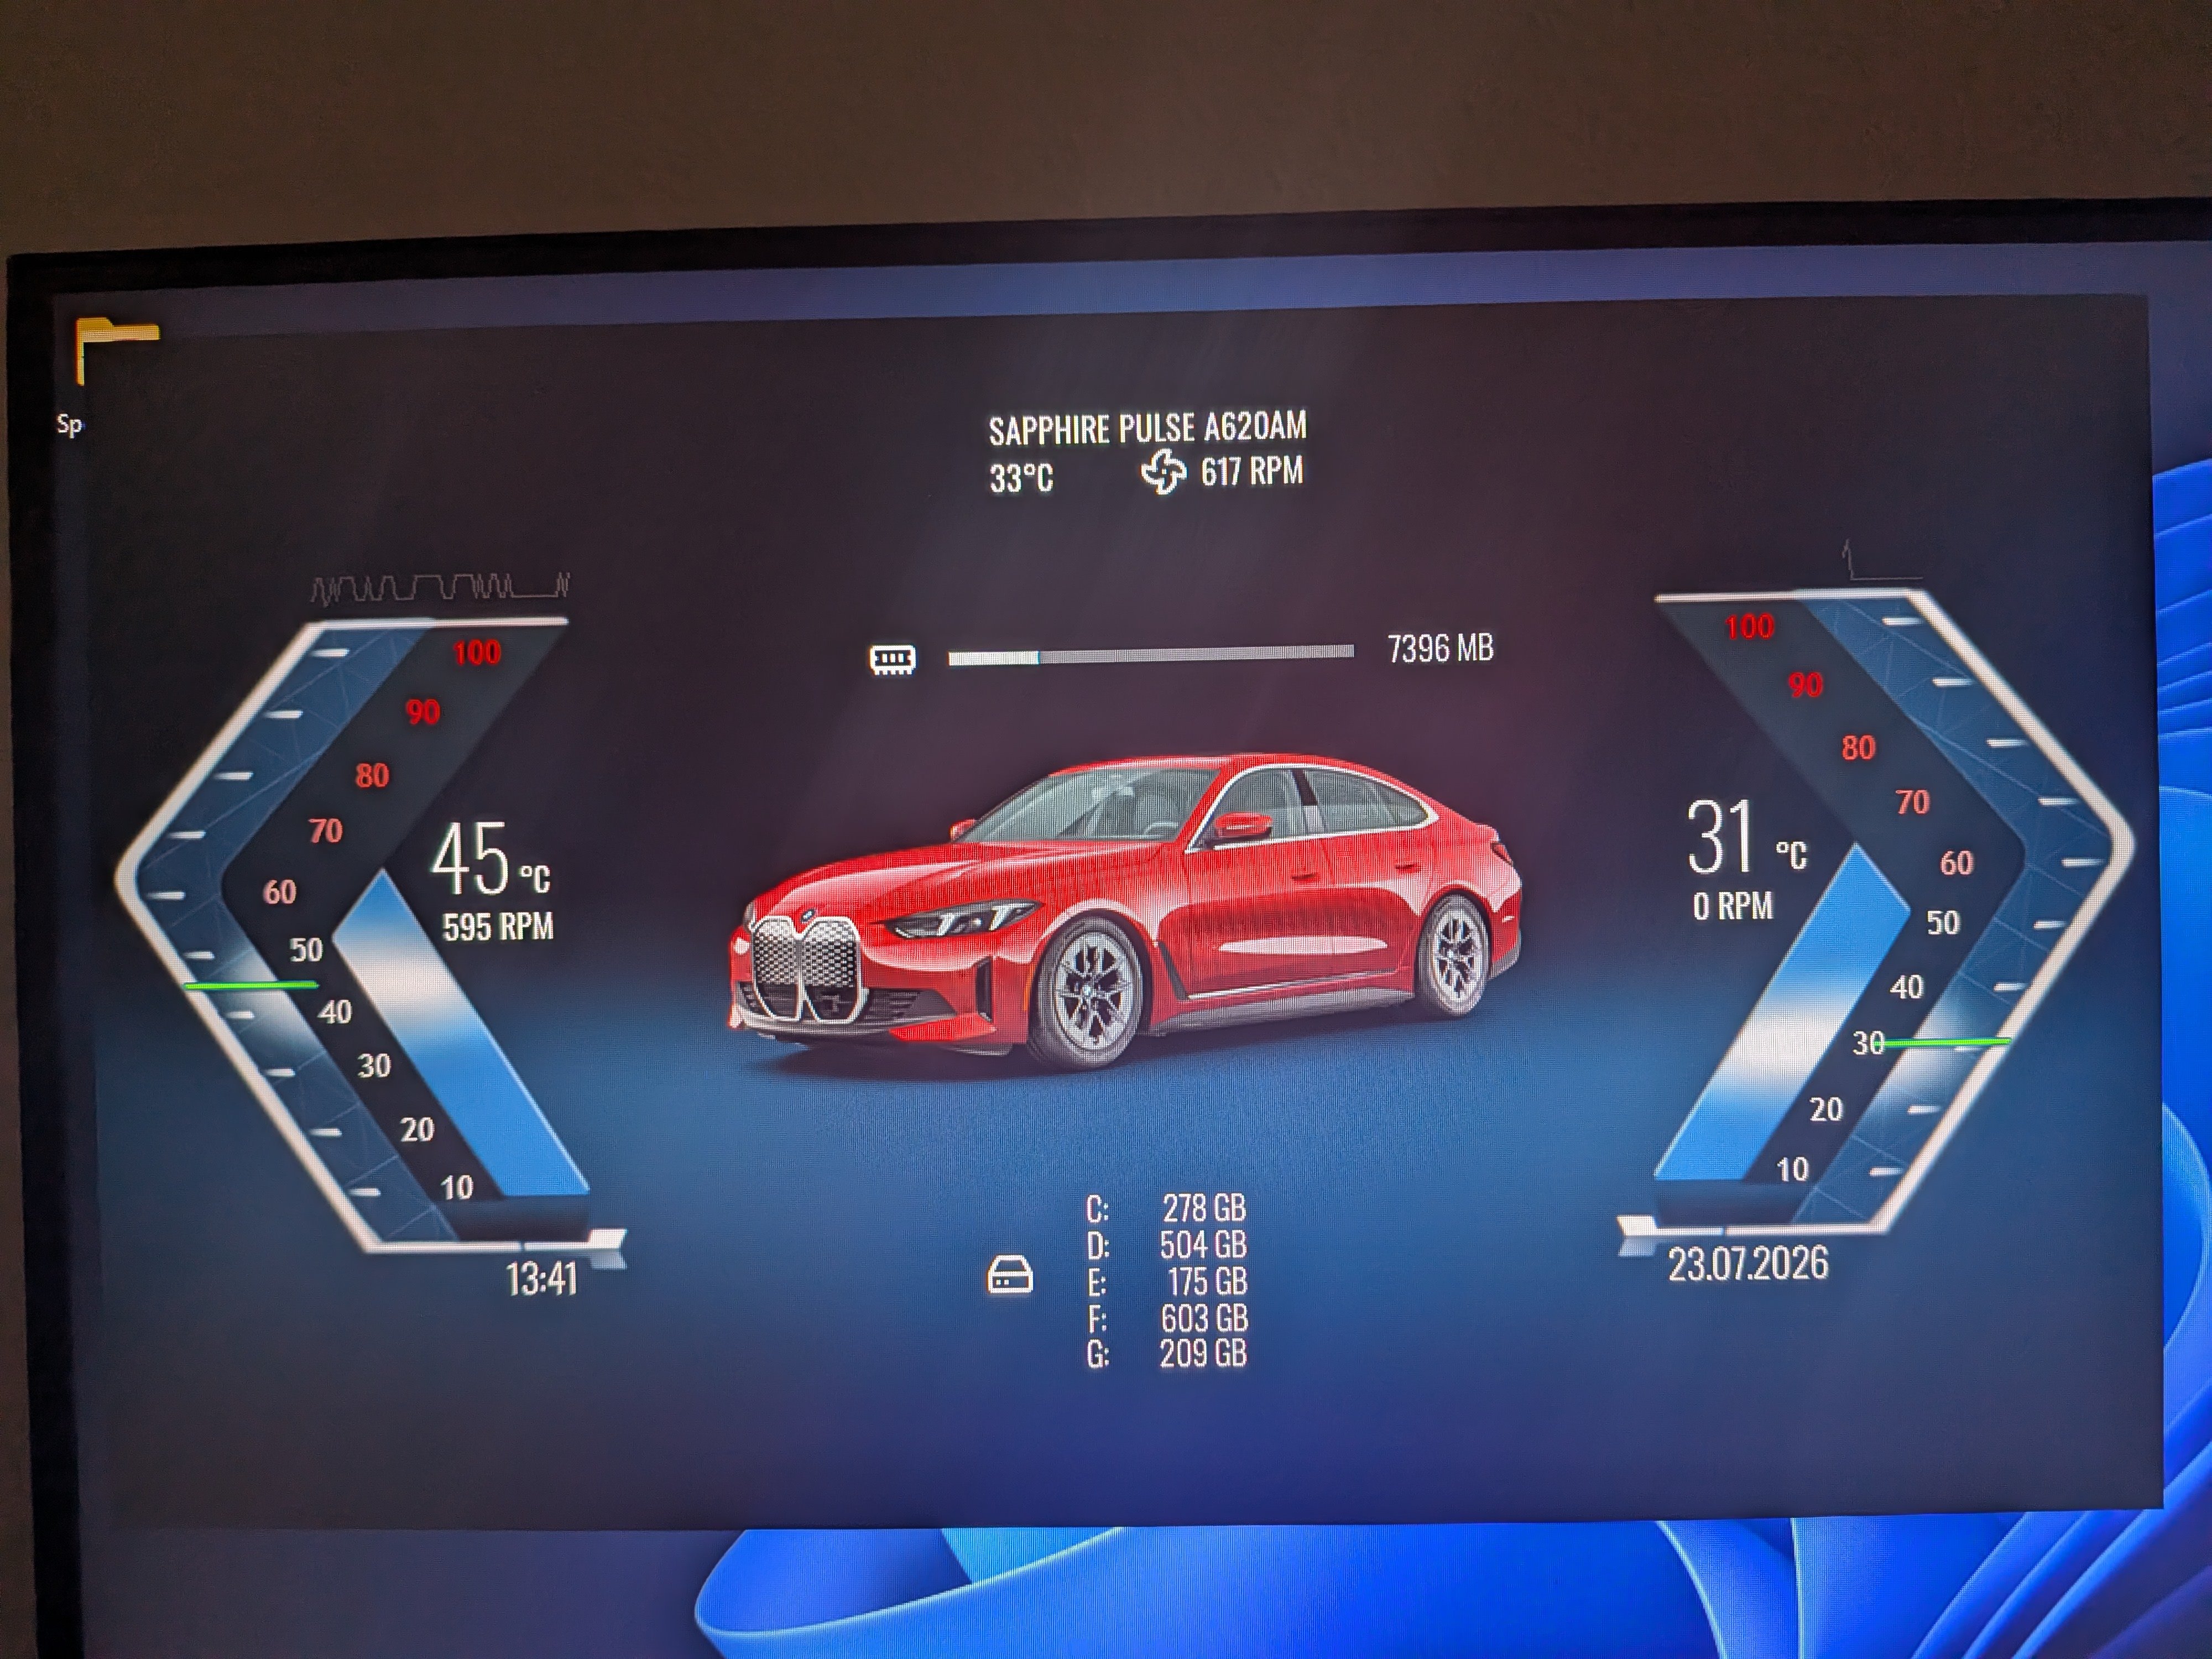
This is a copy of the speedometer from the BMW i4, modified to display sensors.1 point
-
i think i might be in love... i love the graphics for the sensors left and right...1 point
-
The latest AIDA64 update enhances support for next-generation AMD Zen 6, AMD Mustang Peak, and Intel Panther Lake-R processors. It also adds support for new LCD display solutions, USB-NVMe passthrough for the Asus ROG Strix Aiolos, and hardware detection for the AMD Radeon RX 6300 GPU. AIDA64 for Huawei devices AIDA64 for Android has crossed the 10 million download mark at the Play Store. It is also available now in the Huawei AppGallery, a blooming app store that offers automatic updates and various security features. New features & improvements Improved support for AMD Zen 6 based CPUs and APUs Preliminary support for AMD Mustang Peak CPU Preliminary support for Intel Panther Lake-R CPU Thermalright Trofeo Vision 9.16 LCD support Turing (Turzx) 2.8-inch LCD support Waveshare LCD support GPU details for AMD Radeon RX 6300 GPU details for nVIDIA RTX Spark N1X USB-NVMe passthrough support for Asus ROG Strix Aiolos Fixed: crash in the OpenCL layer Fixed: handle leak in ROG AIO LCD module What's new since AIDA64 v8.00 AIDA FPS (AIDA64 Extreme only) Turing (Turzx) 5.2-inch and 8-inch LCD support Azerbaijani localization Optimized memory bandwidth benchmark run times on AMD Milan, Rome, Shimada Peak processors APX optimized SHA3 benchmark for Intel Diamond Rapids and Nova Lake Support for Intel Core Ultra 250K Plus and 270K Plus (aka Arrow Lake-S Refresh) Improved support for Intel Wildcat Lake and Nova Lake CPUs Preliminary support for AMD Zen 6 based APUs Revamped SensorPanel pinning to monitor Native NVMe support Aqua Computer Ampinel and Thermal Grizzly WireView Pro II sensor support MSI MPG Ai1300TS and Ai1600TS PSU monitoring Turing (Turzx) 4.6-inch and 12.3-inch, WeAct LCD support Advanced support for Adaptec RAID controllers USB-NVMe passthrough support for Realtek RTL9220 Support for EXPO 1.2 memory profiles GPU details for AMD Radeon RX 7700 GPU details for Intel Arc Pro B65 and Arc Pro B70 GPU details for nVIDIA RTX Pro 6000D Blackwell Fixed: OSD Panel positioning issues after sleep, suspend, system restart Fixed: RemoteSensor character encoding issues Fixed: SensorPanel positioning issues [ Press Release (English) ] [ What's new in AIDA64 v8.35 ] [ Download ]1 point
-
My new sensor panel BMW
 1 point
 -
probaishok i hope you dont mind i modified your version and also added astral 5090 pin sensing for anyone using corsair xeneon edge i replaced the hdd`s with the sensing pins. https://limewire.com/decrypt?sharingBucketId=b020416e-0029-40e5-ada7-57790659e416&contentItemId=2f6ac4ac-83bf-4360-a1c0-ed6c761cb70d&downloadUrl=https%3A%2F%2Fsp1.strg.com%2Flimewire%2Flmwrntwrk%2Fbuckets%2Fb020416e-0029-40e5-ada7-57790659e416%2F2f6ac4ac-83bf-4360-a1c0-ed6c761cb70d%3FX-Amz-Algorithm%3DAWS4-HMAC-SHA256%26X-Amz-Date%3D20260619T222109Z%26X-Amz-SignedHeaders%3Dhost%26X-Amz-Credential%3D3HMkFzXmKJPnacuYeHAg%2F20260619%2Flmwrntwrk%2Fs3%2Faws4_request%26X-Amz-Expires%3D1800%26X-Amz-Signature%3Ddc2fee6487a39fb893314e9b1dc95bc92a68f0da5bf573fa417e71a17b972b82%26x-lmwrntwrk-request-id%3D01KVGZJGNBJHF152FMSE9HZ2MQ%26x-lmwrntwrk-signature%3DH%252F%252Bh8pBGbQOF%252F%252FU6dxf1p%252FOw38OIxBtCyW8QAwq9e549ScTjzD%252BqEnisgIcUimWkNo4fADYMf%252BU99vDadMbxRFs%253D%26x-max-request-count%3D10000&mediaType=image%2Fjpeg&decryptionKeys=eyJhZXNHY21Kd2siOnsiYWVzS2V5VHlwZSI6IlNZTU1FVFJJQ19BRVMtR0NNX0tFWSIsImp3ayI6eyJhbGciOiJBMjU2R0NNIiwiZXh0Ijp0cnVlLCJrIjoiWkhYM1FjSW9WVk9IOW1NZFhhQzhsUXc0MnNNY2dqOWZVVldhOWdSUTFMdyIsImtleV9vcHMiOlsiZW5jcnlwdCIsImRlY3J5cHQiXSwia3R5Ijoib2N0In19LCJhZXNDdHJKd2siOnsiYWVzS2V5VHlwZSI6IlNZTU1FVFJJQ19BRVMtQ1RSX0tFWSIsImp3ayI6eyJhbGciOiJBMjU2Q1RSIiwiZXh0Ijp0cnVlLCJrIjoiWkhYM1FjSW9WVk9IOW1NZFhhQzhsUXc0MnNNY2dqOWZVVldhOWdSUTFMdyIsImtleV9vcHMiOlsiZW5jcnlwdCIsImRlY3J5cHQiXSwia3R5Ijoib2N0In19fQ _MODIFIED_PINDATA_2026-06-19.rar1 point
-
I am extremely new to all of this sensor panel display. Is there any way anyone would be willing to make a white, black, silver, and red Ohio State University version 1280 x 800 that is vertical?
 1 point
 -
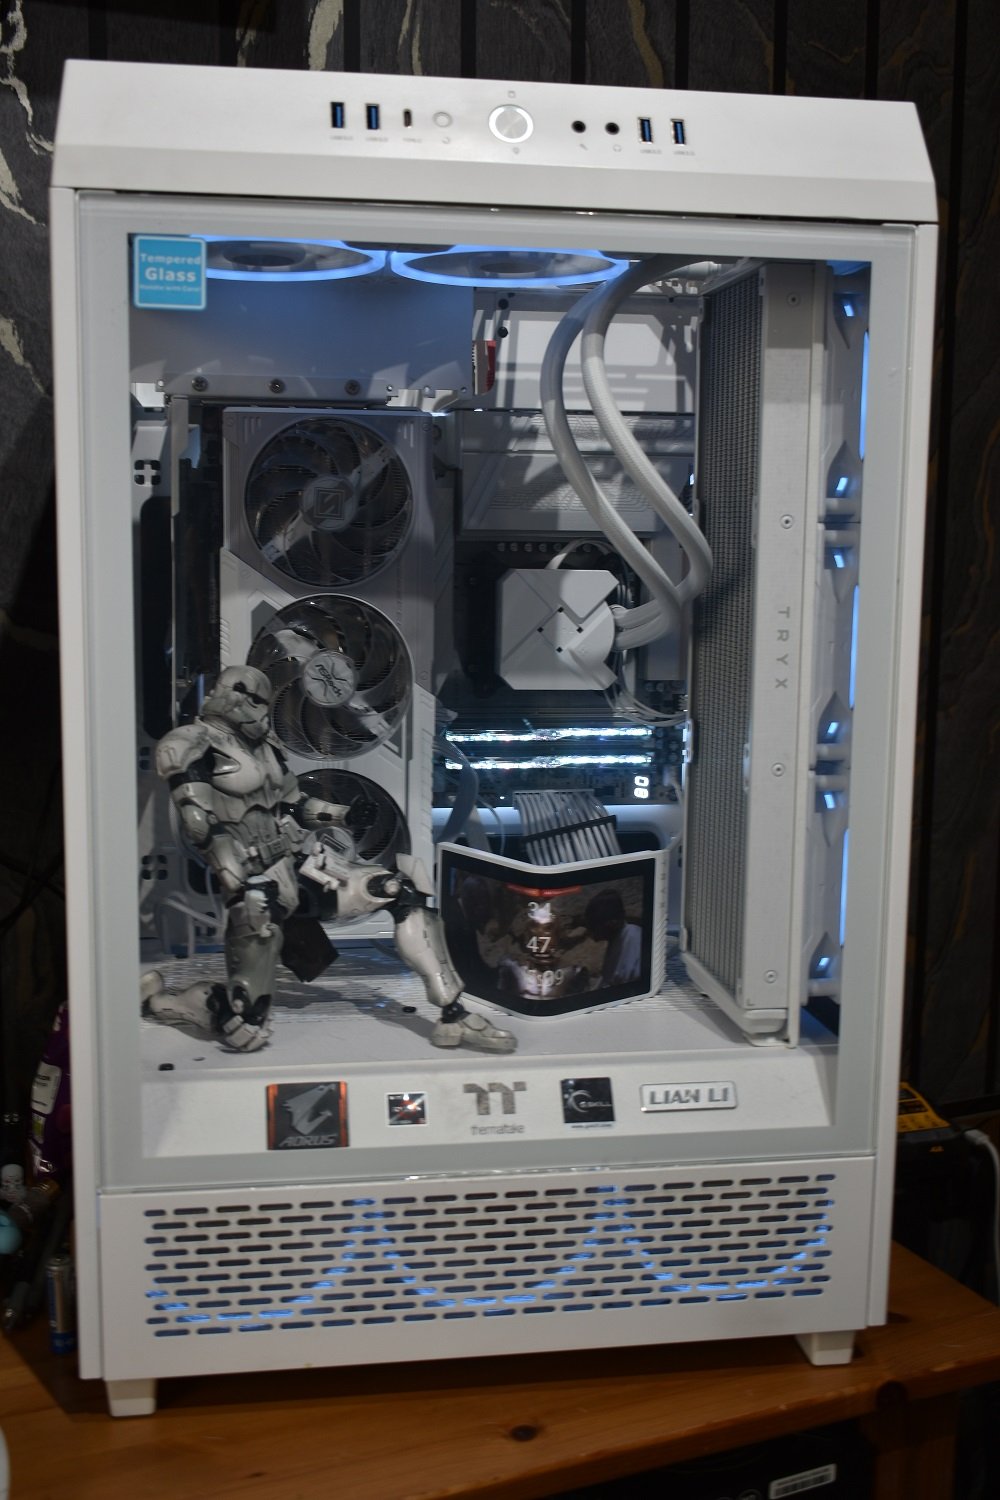
This is my pc build, I have Star Wars IV, V and VI playing in a loop on the TRYX screen, I am using a 768 x 1360 as my panel, I have just made my first gauge using the death star it is 800 x 800, have yet to give it a try. https://uk.pcpartpicker.com/user/Dj.P.King/saved/wLTNvK#

 1 point
 -
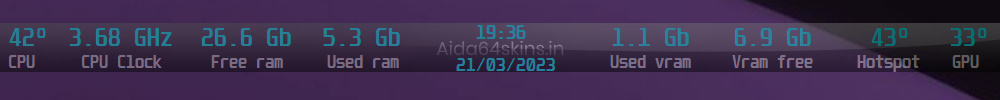
I wanna show new project,very light and simple but i was very impressed of it, transparent information side and top line.Project reason is ( not everyone can buy secondary screen)
 1 point
 -
Вот по моему закончил! Расширение 1024х600. Скачиваем архив, читаем инструкцию! Радуемся! Скачать1 point


.thumb.png.ff5e3c6a15fac63cd20f96ac7f572ae5.png)

.thumb.png.5ffb94b280df24032b6c09d537c9db09.png)