Fiery
-
Posts
12643 -
Joined
-
Last visited
-
Days Won
569
Content Type
Profiles
Forums
Events
Everything posted by Fiery
-
 Thank you. We've tried to replicate the issue on various test systems of ours, but with no luck so far. It would be very helpful if you could help us investigating this issue by disabling GPU sensor support in AIDA64 / main menu / File / Preferences / Stability. Restart AIDA64 after altering that option, and check if it eliminates the issues after resuming from sleep/hibernation. Please let us know how it goes.
 -
Does AIDA64 turn your display green as soon as its splash screen is displayed? Or when its main window is displayed? Or only when you check the GPU parameters on the Display / GPU page? Or only when you check the sensor readings on the Computer / Sensor page?
-
Can you please try to catch what's the last message displayed on the bottom of the AIDA64 splash screen? Perhaps it's Scanning RAID Devices ? Also, please let us know more about your laptop. Full model name/part number, CPU type, storage devices installed, any external (USB or Thunderbolt) devices connected?
-
I'm confused. AIDA64 was never able to detect whether a certain application or game is using DX9, DX10, DX11 or DX12.
-
We'll remove the bogus CPU thermal reading in the next AIDA64 beta update.
-
Thank you for the dumps. Everything looks correct there. When you activate the LCD function for Aquaero (in AIDA64 / main menu / File / Preferences / Hardware Monitoring / LCD / Aquaero), what's displayed by AIDA64? Is there a red error message shown?
-
AMD Athlon X4 860K stuck at 64C while playing any game.
Fiery replied to Luke45's topic in General Discussion
64 Celsius doesn't seem to be excessive for your CPU (or any CPU for that matter). Are you sure the CSGO lagging is due to this thermal state? -
Please try this one: http://users.aida64.com/SDC-USBDriver_v2411.zip
-
Please right-click on the bottom status bar of AIDA64 main window --> CPU Debug --> CPUID & MSR Dump. Copy-paste the full results into this topic, or attach the results as a TXT file to your post. You may need to enable status bar in AIDA64 / main menu / View first. Thanks, Fiery
-
New LCD device support: EVGA Z10 gaming keyboard
Fiery replied to Fiery's topic in Hardware monitoring
Nope: https://forums.evga.com/Z10-Keyboard-Code-to-write-text-to-the-LCD-display-m3012492.aspx -
3rd GPU fan not visible (GeForce GTX 1660 Ti)
Fiery replied to meme23's topic in Hardware monitoring
Please right-click on the bottom status bar of AIDA64 main window --> Video Debug --> nVIDIA GPU Registers. Copy-paste the full results into this topic, or attach the results as a TXT file to your post. You may need to enable status bar in AIDA64 / main menu / View first. Also right-click on the bottom status bar of AIDA64 main window --> Video Debug --> nVIDIA SMBus Dump. Copy-paste the full results into this topic, or attach the results as a TXT file to your post.. Thanks, Fiery -
Please right-click on the bottom status bar of AIDA64 main window --> Sensor Debug --> Aqua Computer Dump. Copy-paste the full results into this topic, or attach the results as a TXT file to your post. You may need to enable status bar in AIDA64 / main menu / View first. Please also let us know the approx. expected values for the readings at (or around) the time you've issued the dump. Thanks, Fiery
-
[Sold] ER-OLEDM032 (SSD1322) 3.2" OLED USB interface
Fiery replied to romP44's topic in Hardware monitoring
That looks awesome! -
Asus Maximus X Formula W_FLOW header missing
Fiery replied to Elderdeekey's topic in Hardware monitoring
We've come up with an idea about that. It will be implemented in the next AIDA64 beta update. I will post a message into this topic once the new beta becomes available for download. -
Please right-click on the bottom status bar of AIDA64 main window --> Sensor Debug --> ISA Sensor Dump. Copy-paste the full results into this topic, or attach the results as a TXT file to your post. You may need to enable status bar in AIDA64 / main menu / View first. Thanks, Fiery
-
Thank you for your feedback. When it comes to Intel processors, CPU power draw can only be measured on Sandy Bridge and later processors.
-
Martin's explanation there specifically talks about effective clock being an average, while the classic clock frequency measurement being instant (discrete). IMHO it should be the responsibility of the CPU maker to make sure that by simply detecting the core multiplier the core shouldn't wake up or change its power state. In fact, we've been requesting a more user-friendly and more accurate way of measuring CPU core clock frequency at both AMD and Intel for years, one that wouldn't require elevation (administrator privileges) as well. We're hoping that eventually it will be implemented in all x86 processors in a proper way. Till then, I still reckon AIDA64 is correct, simply because it reports the CPU multiplier and resulting core clock frequency as it is, without any tricks, conversions or averaging.
-
fixed: Asus Prime Z390-A/H10 Fan Sensors not showing
Fiery replied to willem's topic in Hardware monitoring
We will add support for your motherboard in the next AIDA64 beta update. I will post a message into this topic once the new beta is available for download. -
We will alter the GLCD2USB module to support 8 pages in the next AIDA64 beta update. I'll post a message into this topic once the new beta build is available for download.
-
Have you tried to restart Windows after the upgrade?
-
I'm not sure if you can always assume that.
-
Cache and Memory benchmark bug or?
Fiery replied to Entranced's topic in Benchmarking, system performance
Then it must have been a timer mixup. If you see the same issue to happen, just restart Windows and it should fix itself again -
Please note that it's not possible to diagnose such issues remotely. You may want to take your phone to a local specialist and have it checked out.
-
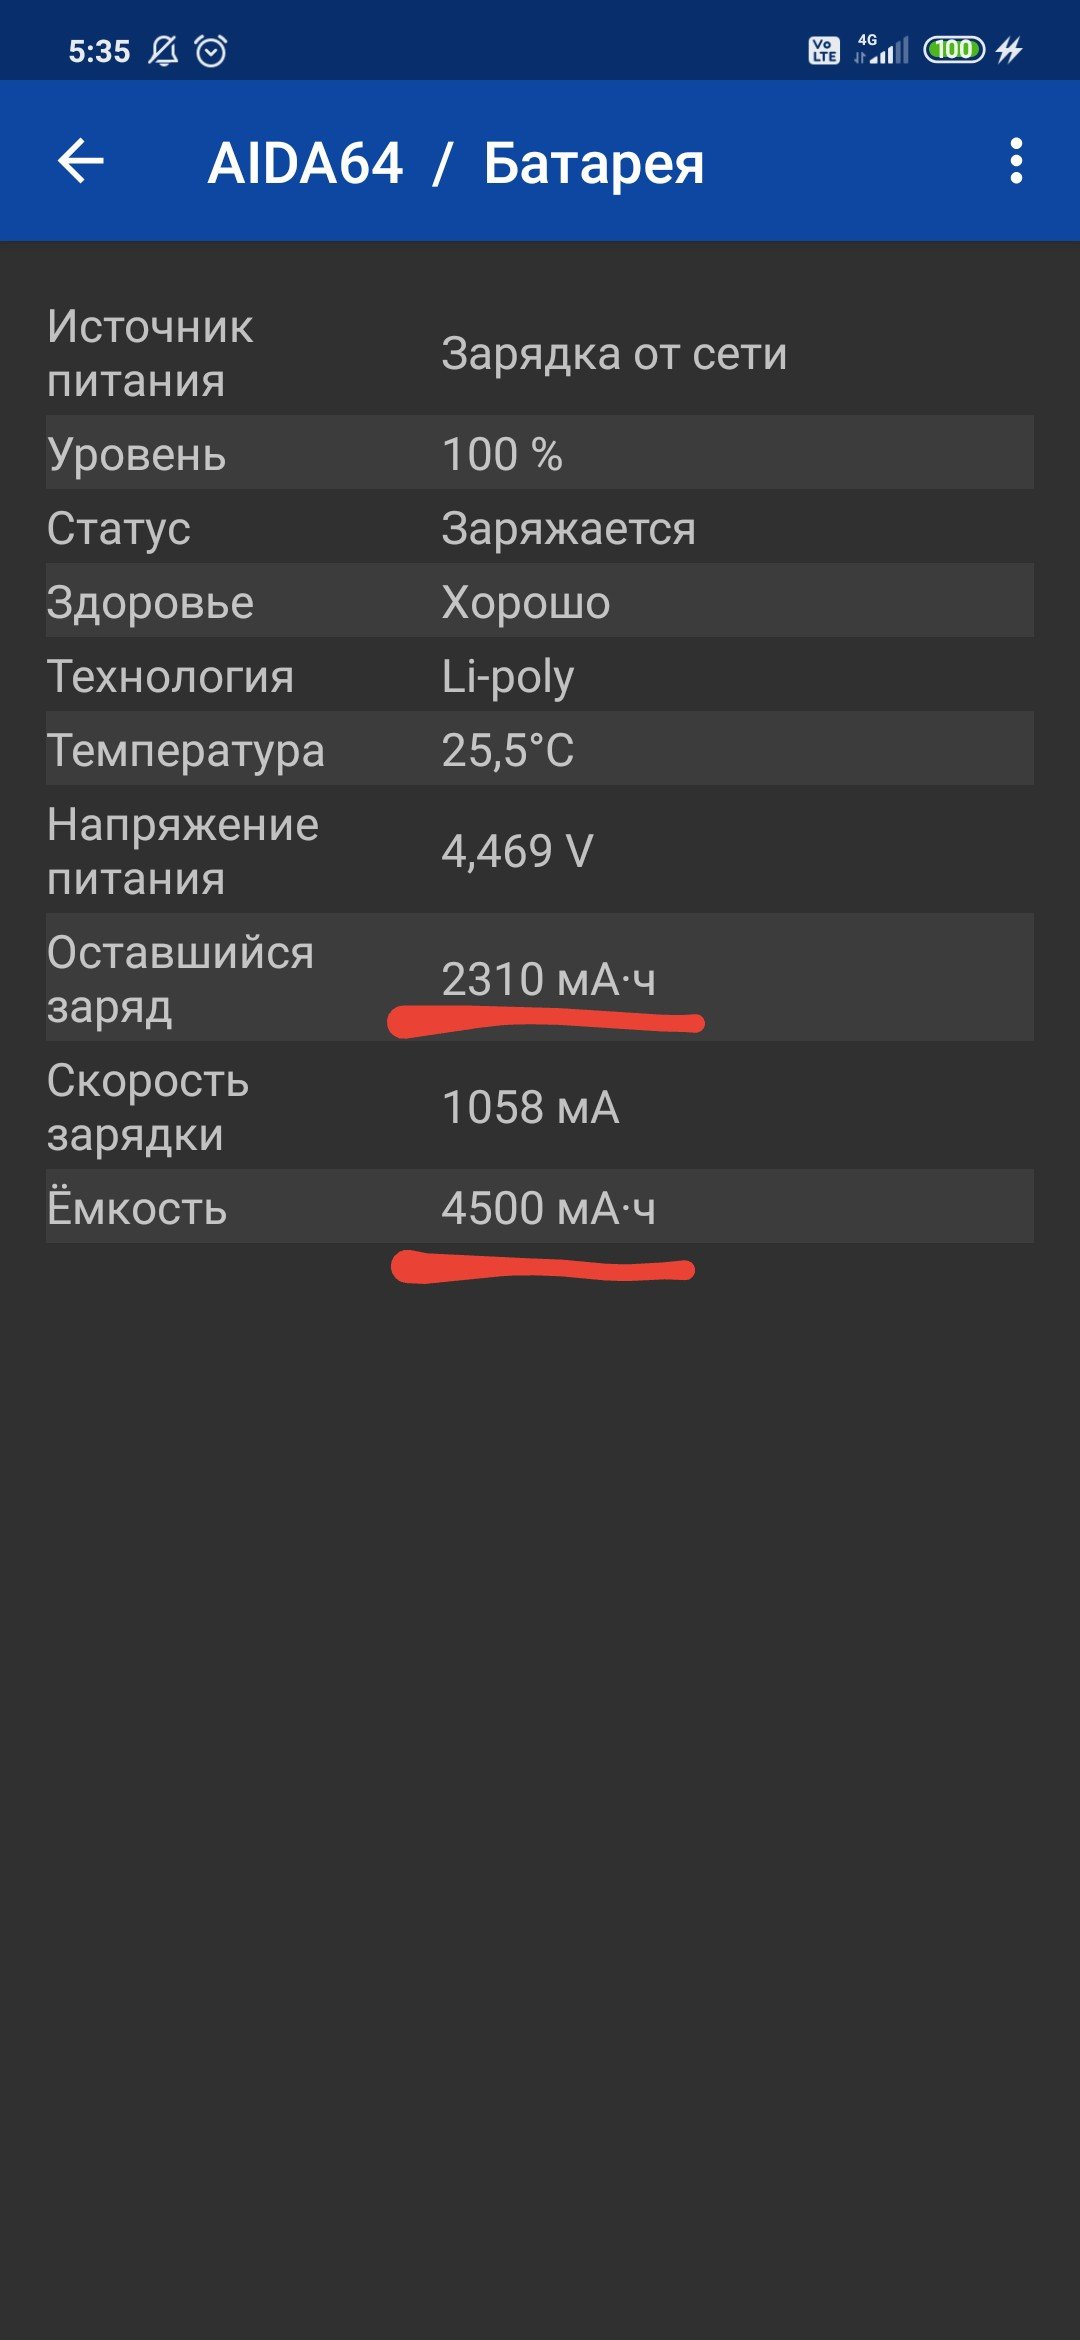
Please note that on many devices the standard Android Battery API is inadequately implemented, and fails to provide proper charge counter information for the battery.

-
Please let us know more about your system configuration. Motherboard model, CPU type, video card(s) installed, any special monitoring or liquid cooling device connected? (via USB for example)