


Fiery
-
Posts
12643 -
Joined
-
Last visited
-
Days Won
569
Content Type
Profiles
Forums
Events
Everything posted by Fiery
-
Yes, AIDA64 v7.50 (latest version) should be able to report EC_TEMP2 on your motherboard as long as it has the thermistor cable connected.
-
In AIDA64 please press Ctrl+D --> Video Debug --> ATI GPU Registers. Copy-paste the full results into this topic, or attach the results as a TXT file to your post. Thanks, Fiery
-

AIDA64 doesn't detect any fans of Minisforum MS-A1 barebone
Fiery replied to Iceberg's topic in Bug reports
Thank you! Please create one more round of the Embedded Controller Dump to let us see how the registers change between two instances of issuing the dump. Thanks. -
AIDA64 doesn't detect any fans of Minisforum MS-A1 barebone
Fiery replied to Iceberg's topic in Bug reports
In AIDA64 please press Ctrl+D --> Sensor Debug --> Embedded Controller Dump. Copy-paste the full results into this topic, or attach the results as a TXT file to your post. Thanks, Fiery -
Your AIDA64 installation is incomplete or broken. Try to reinstall it.
-
Around Easter.
-
Simple MAD/FMA instructions.
-
AIDA64 relies on the ROG AIO SDK module that is developed by Asus. Unfortunately they no longer see it a priority to support their first generation RYUJIN displays
-
Please explain with more details what exactly is stuck.
-
Error USB device 1908-0102 not found for AX206
Fiery replied to CastusTroy's topic in Hardware monitoring
You don't have an AX206 LCD display. What you've got is a 3.5-inch Turing (Turzx) Smart Screen which is not yet supported by AIDA64. We're currently working on implementing support for all Turing displays available on the market. -
@RainerHH @Korvenwin @amuro1 We are working on supporting multiple variants of the Turzx screens (a.k.a. Turing Smart Screen).
- 11 replies
-
- 1
-

-
- turing smart screen
- turzx
- (and 2 more)
-
I've sent you a private message about this.
-
fixed: New ASRock B650E PG Riptide WiFi Missing sensors
Fiery replied to The Mac's topic in Hardware monitoring
Thank you for your feedback! Happy New Year! -
aida64 extreme sensor panel don't see my rtx 4070 ti super all specs
Fiery replied to vlado015's topic in Bug reports
Make sure to upgrade to the latest version of AIDA64 Extreme available at: https://www.aida64.com/downloads/latesta64xe After upgrading to this new version, make sure to restart Windows to finalize the upgrade. -
We cannot communicate directly with the display device, but we have to rely on the SDK module that Asus develops and supplies us. That module seems to have issues communicating with the device. It's not possible for us to fix this at our end, so you gotta report the issues to Asus Support and they will have to fix their SDK module.
-
Negative (C°) display? (MSI MEG Z790 Ace Max)
Fiery replied to Arctucas's topic in Hardware monitoring
Thank you for your feedback! -
Your dGPU (RX 7600S) is only supported since AIDA64 v7.20. So when you renew your license you will be able to monitor your dGPU using AIDA64 v7.50 (latest version).
-
fixed: Encounter image problem after updated to ver. 7.50.7200
Fiery replied to BHSY's topic in Hardware monitoring
Thank you! Please keep reporting in case you run into any further issues.- 24 replies
-
- 2
-
-
- 7.50.7209 beta
- background image
- (and 3 more)
-
fixed: Encounter image problem after updated to ver. 7.50.7200
Fiery replied to BHSY's topic in Hardware monitoring
Thank you for your feedback -
Thank you for your feedback!
-
fixed: Encounter image problem after updated to ver. 7.50.7200
Fiery replied to BHSY's topic in Hardware monitoring
- 24 replies
-
- 1
-
-
- 7.50.7209 beta
- background image
- (and 3 more)
-
fixed: Encounter image problem after updated to ver. 7.50.7200
Fiery replied to BHSY's topic in Hardware monitoring
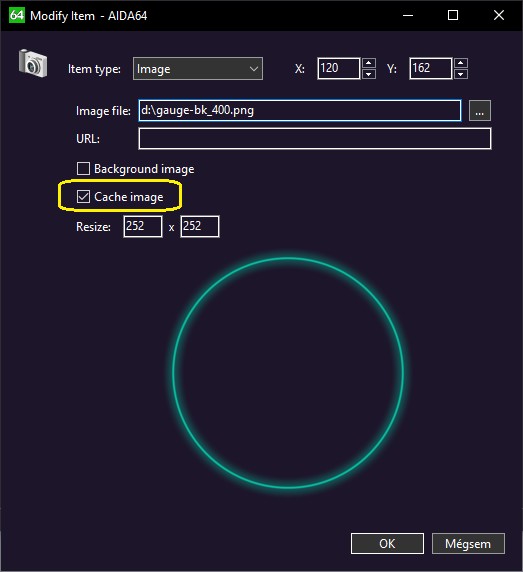
We've implemented a folder watch trick to update cached images whenever they change. This will help to ease editing and on-the-fly changes to your SensorPanel layout. Make sure to upgrade to the latest beta version of AIDA64 Extreme available at: https://www.aida64.com/downloads/latesta64xebeta Make sure to leave the Cache Image checkbox checked (enabled). If it works out for both images and custom gauge states, we will remove the Cache Image option.- 24 replies
-
- 2
-
-
- 7.50.7209 beta
- background image
- (and 3 more)
-
We've implemented a folder watch trick to update cached images whenever they change. This will help to ease editing and on-the-fly changes to your SensorPanel layout. Make sure to upgrade to the latest beta version of AIDA64 Extreme available at: https://www.aida64.com/downloads/latesta64xebeta Make sure to leave the Cache Image checkbox checked (enabled). If it works out for both images and custom gauge states, we will remove the Cache Image option.
-
We've implemented them both in the latest AIDA64 beta update available at: https://www.aida64.com/downloads/latesta64xebeta
